8.EE.5
Compare the following graph and table to
determine which object is moving at a
g...

Mathematics, 06.04.2021 20:30 naomicervero
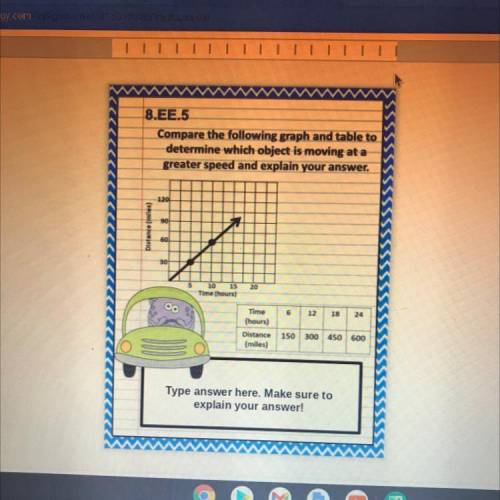
8.EE.5
Compare the following graph and table to
determine which object is moving at a
greater speed and explain your answer.
120
90
Distance (miles)
60
30
10
20
15
Time hours)
Oo
6
Time
12 18 24
(hours)
Distance 150 300 450 600
(miles)
Type answer here. Make sure to
explain your answer!

Answers: 2
Another question on Mathematics
Mathematics, 21.06.2019 12:40
The price of a particular stock is represented by the linear equation , where x represents the number of weeks the stock has been owned and y represents the price of the stock, in dollars. if this relationship continues, what is the price of the stock after it has been owned for 12 weeks? $92.55 $94.37 $100.52 $114.39
Answers: 3
Mathematics, 22.06.2019 02:00
1. the manager of collins import autos believes the number of cars sold in a day (q) depends on two factors: (1) the number of hours the dealership is open (h) and (2) the number of salespersons working that day (s). after collecting data for two months (53 days), the manager estimates the following log-linear model: q 4 equation 1 a. explain, how to transform the log-linear model into linear form that can be estimated using multiple regression analysis. the computer output for the multiple regression analysis is shown below: q4 table b. how do you interpret coefficients b and c? if the dealership increases the number of salespersons by 20%, what will be the percentage increase in daily sales? c. test the overall model for statistical significance at the 5% significance level. d. what percent of the total variation in daily auto sales is explained by this equation? what could you suggest to increase this percentage? e. test the intercept for statistical significance at the 5% level of significance. if h and s both equal 0, are sales expected to be 0? explain why or why not? f. test the estimated coefficient b for statistical significance. if the dealership decreases its hours of operation by 10%, what is the expected impact on daily sales?
Answers: 2
Mathematics, 22.06.2019 04:30
6points possible: 3. total attempts: 5 for the data shown, answer the questions. round to 2 decimal places. x 7.3 11.7 21.7 18.8 23.2 20.7 29.7 21.2 10.6 find the mean: find the median: find the standard deviation:
Answers: 2
You know the right answer?
Questions


Mathematics, 29.07.2019 19:00
Mathematics, 29.07.2019 19:00


Mathematics, 29.07.2019 19:00
Mathematics, 29.07.2019 19:00
History, 29.07.2019 19:00

Chemistry, 29.07.2019 19:00

Health, 29.07.2019 19:00

Biology, 29.07.2019 19:00


