
Mathematics, 06.04.2021 07:00 EllaSue
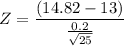
The calibration of a scale is to be checked by weighing a 13 kg test specimen 25 times. Suppose that the results of different weighings are independent of one another and that the weight on each trial is normally distributed with Sigma = 0.200 kg. Let µ denote the true average weight reading on the scale.
Required:
a. What hypotheses should be tested?
b. With the sample mean itself as the test statistic, what is the P-value?

Answers: 2


Another question on Mathematics
Mathematics, 21.06.2019 23:00
Each of the following data sets has a mean of x = 10. (i) 8 9 10 11 12 (ii) 7 9 10 11 13 (iii) 7 8 10 12 13 (a) without doing any computations, order the data sets according to increasing value of standard deviations. (i), (iii), (ii) (ii), (i), (iii) (iii), (i), (ii) (iii), (ii), (i) (i), (ii), (iii) (ii), (iii), (i) (b) why do you expect the difference in standard deviations between data sets (i) and (ii) to be greater than the difference in standard deviations between data sets (ii) and (iii)? hint: consider how much the data in the respective sets differ from the mean. the data change between data sets (i) and (ii) increased the squared difference îł(x - x)2 by more than data sets (ii) and (iii). the data change between data sets (ii) and (iii) increased the squared difference îł(x - x)2 by more than data sets (i) and (ii). the data change between data sets (i) and (ii) decreased the squared difference îł(x - x)2 by more than data sets (ii) and (iii). none of the above
Answers: 2
Mathematics, 22.06.2019 01:30
Acontainer holds 0.7 liters of oil and vinegar. 3/4 of the mixture is vinegar. how many liters of oil are in the container? express your answer as both a fraction and a decimal.
Answers: 1
Mathematics, 22.06.2019 03:20
Aconcession manager at yankee stadium wants to know how temperature affects beer sales. she took a sample of 10 games and recorded the number of beers sold and the temperature in the middle of the game. temperature 80 68 78 79 87 74 86 92 77 84 number of beers 20533 1439 13829 21286 30985 17187 30240 87596 9610 28742 a. draw a scatter plot of the data. b. the manager estimates the regression equation to be: numberofbeers = −100, 678 + 1, 513 ∗ temperature draw this on your scatter plot. c. for one of the estimated points, indicate the residual with ei . d. for that same point, indicate what part of the variation is explained by the model with ˆyi − y¯.
Answers: 2
You know the right answer?
The calibration of a scale is to be checked by weighing a 13 kg test specimen 25 times. Suppose that...
Questions


History, 03.09.2020 06:01
History, 03.09.2020 06:01
History, 03.09.2020 06:01

Mathematics, 03.09.2020 06:01
Mathematics, 03.09.2020 06:01

Advanced Placement (AP), 03.09.2020 06:01


Chemistry, 03.09.2020 06:01


