
Mathematics, 31.03.2021 16:10 EndiaGracee
(08.05;08.06 HC)
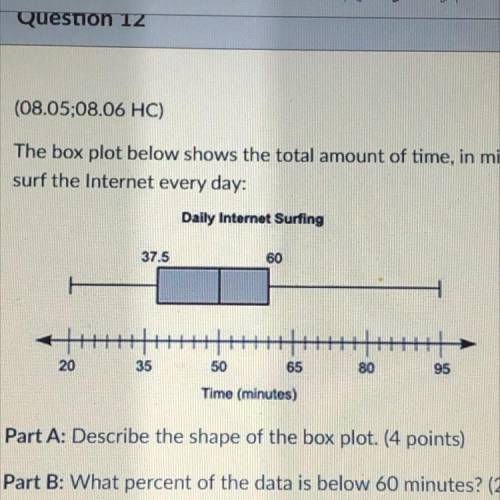
The box plot below shows the total amount of time, in minutes, the students of a class
surf the Internet every day:
Daily Internet Surfing
37.5
60
20
35
50
65
80
95
Time (minutes)
Part A: Describe the shape of the box plot. (4 points)
Part B: What percent of the data is below 60 minutes? (2 points)
Part C: Calculate the interquartile range of the data, and explain in a sentence or two
what it represents. (4 points)

Answers: 2
Another question on Mathematics
Mathematics, 21.06.2019 19:10
What is the quotient of m^6/5 ÷ 5/m^2? assume m does not equal pl
Answers: 1
Mathematics, 22.06.2019 00:00
Find the distance between the point (-3,-4), and (see the picture below)
Answers: 1
Mathematics, 22.06.2019 01:30
Jacob is graphing the line represented by the equation −6x−5y=12.−6x−5y=12. he first plots the x-x- and y-interceptsy-intercepts as follows. which statement is correct regarding the intercepts on the graph?
Answers: 1
Mathematics, 22.06.2019 02:30
Which verbal expression best describes the algebraic expression 3x ÷ 5? the quotient of three times some number and five the product of some number and five divided by three the quotient of three and some number times five the sum of three and some number divided by five
Answers: 1
You know the right answer?
(08.05;08.06 HC)
The box plot below shows the total amount of time, in minutes, the students of a c...
Questions
Mathematics, 16.01.2020 08:31


Mathematics, 16.01.2020 08:31
Mathematics, 16.01.2020 08:31
Mathematics, 16.01.2020 08:31

Biology, 16.01.2020 08:31
Mathematics, 16.01.2020 08:31

History, 16.01.2020 08:31

Advanced Placement (AP), 16.01.2020 08:31
English, 16.01.2020 08:31
History, 16.01.2020 08:31


