
Mathematics, 31.03.2021 01:30 rosenatalie222
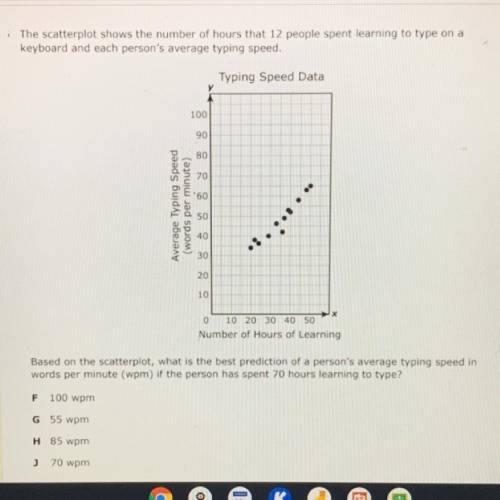
The scatterplot shows the average number of hours each of 13 people spends at work every
week and the average number of hours each of them spends on recreational activities every
week.
Working and Relaxing
40
35
30
25
Recreational Activities (hours)
20
15
10
5
0
10 20 30 40 50 60 70 80 90
Work (hours)
Based on the scatterplot, what is the best prediction of the average number of hours a person
spends at work every week if that person spends an average of 10 hours on recreational
activities every week?
A 33 h
B 85 h
C50 h
D 65 h

Answers: 3
Another question on Mathematics
Mathematics, 21.06.2019 17:30
For each proportion find the unknown number x 1/5/8=×/15
Answers: 1
Mathematics, 21.06.2019 17:30
What is the number 321,000,000 in scientific notation? also what is the number? ?
Answers: 2
Mathematics, 21.06.2019 18:20
17. a researcher measures three variables, x, y, and z for each individual in a sample of n = 20. the pearson correlations for this sample are rxy = 0.6, rxz = 0.4, and ryz = 0.7. a. find the partial correlation between x and y, holding z constant. b. find the partial correlation between x and z, holding y constant. (hint: simply switch the labels for the variables y and z to correspond with the labels in the equation.) gravetter, frederick j. statistics for the behavioral sciences (p. 526). cengage learning. kindle edition.
Answers: 2
You know the right answer?
The scatterplot shows the average number of hours each of 13 people spends at work every
week and t...
Questions


Computers and Technology, 25.03.2020 05:14
Mathematics, 25.03.2020 05:14

Mathematics, 25.03.2020 05:14
Mathematics, 25.03.2020 05:14
Mathematics, 25.03.2020 05:14

Advanced Placement (AP), 25.03.2020 05:14

Biology, 25.03.2020 05:15


History, 25.03.2020 05:15

English, 25.03.2020 05:15
History, 25.03.2020 05:16


