
Mathematics, 30.03.2021 01:50 coolkitty35
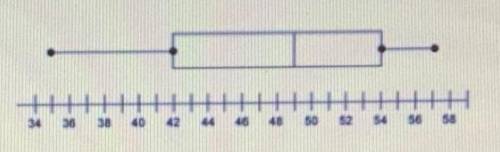
The box and whisker plot represents the number of telemarketing calls received by households last month. Which statements are
correct?
A)
The mean of the data is 49.
B)
The median of the data is 49.
The least number of calls is 35.
D)
The third quartile is represented by 42.
E)
The mean cannot be determined by the box and whisker plot.

Answers: 3
Another question on Mathematics
Mathematics, 21.06.2019 17:00
The table below shows the height of a ball x seconds after being kicked. what values, rounded to the nearest whole number, complete the quadratic regression equation that models the data? f(x) = x2 + x + 0based on the regression equation and rounded to the nearest whole number, what is the estimated height after 0.25 seconds? feet
Answers: 2
Mathematics, 21.06.2019 18:10
which of the following sets of data would produce the largest value for an independent-measures t statistic? the two sample means are 10 and 20 with variances of 20 and 25 the two sample means are 10 and 20 with variances of 120 and 125 the two sample means are 10 and 12 with sample variances of 20 and 25 the two sample means are 10 and 12 with variances of 120 and 125
Answers: 2
Mathematics, 21.06.2019 20:40
The roots of the function f(x) = x2 – 2x – 3 are shown. what is the missing number?
Answers: 2
Mathematics, 21.06.2019 21:00
Evaluate this using ! 0.25^2 x 2.4 + 0.25 x 2.4^2 − 0.25 x 2.4 x 0.65
Answers: 1
You know the right answer?
The box and whisker plot represents the number of telemarketing calls received by households last mo...
Questions

Biology, 06.11.2020 09:20

English, 06.11.2020 09:20

Mathematics, 06.11.2020 09:20
Mathematics, 06.11.2020 09:20

Social Studies, 06.11.2020 09:20
Mathematics, 06.11.2020 09:20

Computers and Technology, 06.11.2020 09:20


Chemistry, 06.11.2020 09:20


