Please please help me.
I will give you
If you answer this
An Olympic swimmer co...

Mathematics, 29.03.2021 16:30 WhitneyNH4261
Please please help me.
I will give you
If you answer this
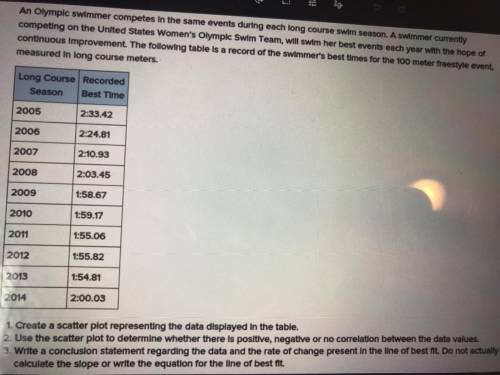
An Olympic swimmer competes in the same events during each long course swim season. A swimmer currently
competing on the United States Women's Olympic Swim Team, will swim her best events each year with the hope of
continuous Improvement. The following table is a record of the swimmer's best times for the 100 meter freestyle event,
measured In long course meters.
Long Course Recorded
Season Best Time
2005 2:33.42
2006
2:24.81
2007
2:10.93
2008
2:03.45
2009
1:58.67
2010
1:59.17
1:55.06
2011
2012
1:55.82
2013
1:54.81
2014
2:00.03
1. Create a scatter plot representing the data displayed in the table.
2. Use the scatter plot to determine whether there is positive, negative or no correlation between the data values.
3. Write a conclusion statement regarding the data and the rate of change present in the line of best fit. Do not actually
calculate the slope or write the equation for the line of best fit.
Please help me
Will give
Just give me the answer to 2 and 3
I already have 1
I just need 2 and 3
Please and thank you
Please answer this

Answers: 2
Another question on Mathematics
Mathematics, 21.06.2019 14:00
The graph of a line gets what as the value of the slope gets bigger
Answers: 2
Mathematics, 21.06.2019 21:00
Consider the polynomials given below. p(x) = x4 + 3x3 + 2x2 – x + 2 q(x) = (x3 + 2x2 + 3)(x2 – 2) determine the operation that results in the simplified expression below. 35 + x4 – 573 - 3x2 + x - 8 a. p+q b. pq c.q-p d. p-q
Answers: 2
Mathematics, 21.06.2019 23:00
According to a study conducted in 2015, 18% of shoppers said that they prefer to buy generic instead of name-brand products. suppose that in a recent sample of 1500 shoppers, 315 stated that they prefer to buy generic instead of name-brand products. at a 5% significance level, can you conclude that the proportion of all shoppers who currently prefer to buy generic instead of name-brand products is higher than .18? use both the p-value and the critical-value approaches.
Answers: 1
Mathematics, 22.06.2019 01:00
In each diagram, line p is parallel to line f, and line t intersects lines p and f. based on the diagram, what is the value of x? ( provide explanation)
Answers: 1
You know the right answer?
Questions


Social Studies, 03.01.2021 14:00


English, 03.01.2021 14:00
Mathematics, 03.01.2021 14:00
Mathematics, 03.01.2021 14:00
Social Studies, 03.01.2021 14:00

Advanced Placement (AP), 03.01.2021 14:00
Mathematics, 03.01.2021 14:00
Social Studies, 03.01.2021 14:00
Mathematics, 03.01.2021 14:00
Mathematics, 03.01.2021 14:00

Biology, 03.01.2021 14:00
Mathematics, 03.01.2021 14:00
Biology, 03.01.2021 14:00

Health, 03.01.2021 14:00
History, 03.01.2021 14:00


