
Mathematics, 27.03.2021 05:00 xdaciax
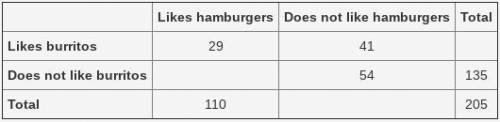
A food truck did a daily survey of customers to find their food preferences. The data is partially entered in the frequency table. Complete the table to analyze the data and answer the questions: (Table attached)
Part A: What percentage of the survey respondents do not like both hamburgers and burritos? (2 points)
Part B: What is the marginal relative frequency of all customers that like hamburgers? (3 points)
Part C: Use the conditional relative frequencies to determine which data point has strongest association of its two factors. Use complete sentences to explain your answer. (5 points)
Please try to answer part C at least if you don't want to do the first two parts! It's C I'm really stuck on! Will give Brainliest, please explain and show work!

Answers: 1
Another question on Mathematics
Mathematics, 21.06.2019 16:30
On average, how many more hits will he get when he bats 100 times at home during the day as opposed to 100 times away at night?
Answers: 2
Mathematics, 22.06.2019 04:30
What is the measure of angle lkj ? round to the nearest whole degree
Answers: 1
Mathematics, 22.06.2019 06:00
Asap 25 pts + brainliest to right/best answer only answer if you know for sure
Answers: 1
You know the right answer?
A food truck did a daily survey of customers to find their food preferences. The data is partially e...
Questions

Mathematics, 25.10.2020 09:00
Mathematics, 25.10.2020 09:00
Mathematics, 25.10.2020 09:00

Biology, 25.10.2020 09:00
Mathematics, 25.10.2020 09:00
Mathematics, 25.10.2020 09:00
Mathematics, 25.10.2020 09:00

Health, 25.10.2020 09:00

Mathematics, 25.10.2020 09:00

Computers and Technology, 25.10.2020 09:00

Chemistry, 25.10.2020 09:00


