
Mathematics, 26.03.2021 20:10 NetherisIsTheQueen
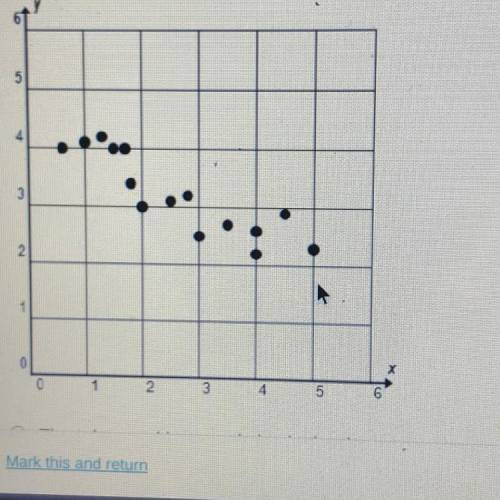
Which describes the correlation shown in the scatterplot?
A. There is a positive correlation in the data set
B. There is a negative correlation in the data set
C. There is no correlation in the data set
D. More points are needed to determine the correlation
please help all is appreciated!

Answers: 3
Another question on Mathematics
Mathematics, 21.06.2019 15:30
Gretchen is setting up for a banquet. she has 300 chairs and needs to distribute them evenly among t tables. how many chairs should she put at each table? write your answer as an expression.
Answers: 1
Mathematics, 21.06.2019 18:00
The los angels ram scored 26, 30, 48, and 31 pts in their last four games. how many pts do they need to score in super bowl liii in order to have an exact mean average of 35 pts over five games. write and solve and equation. use x to represent the 5th game.
Answers: 1
Mathematics, 21.06.2019 21:40
Ineed your ! i was to turn this into pond first thing i gotta do is outline the inside with this plastic how big should i cut the plastic the height: 10 1/2” the length: 40” the width: 12” me !
Answers: 1
You know the right answer?
Which describes the correlation shown in the scatterplot?
A. There is a positive correlation in the...
Questions


History, 29.07.2019 09:30


History, 29.07.2019 09:30
Biology, 29.07.2019 09:30


