
Mathematics, 26.03.2021 07:30 savidgarcia303
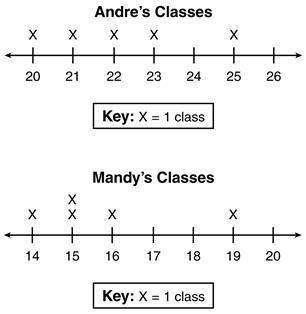
The line plots below show the number of students in each of Andre’s and Mandy’s classes at school. Approximately how many times larger is the difference between the means of the number of students in Andre’s and Mandy’s classes compared to the range?

Answers: 1
Another question on Mathematics
Mathematics, 21.06.2019 21:00
What is the length and width of a 84.5 square foot rug? will mark
Answers: 1
Mathematics, 22.06.2019 00:40
Astock has a 25% probability of increasing by $10 and a 75% probability of decreasing by $5. what is the stocks expected increase or decrease?
Answers: 1
Mathematics, 22.06.2019 01:00
Michael split a rope that was 28 inches long into 5 equal parts. brenden split a rope that was 30 inches long into 6 equal parts. which boy's rope was cut into longer pieces?
Answers: 1
Mathematics, 22.06.2019 02:10
Overproduction of uric acid in the body can be an indication of cell breakdown. this may be an advance indication of illness such as gout, leukemia, or lymphoma.† over a period of months, an adult male patient has taken nine blood tests for uric acid. the mean concentration was x = 5.35 mg/dl. the distribution of uric acid in healthy adult males can be assumed to be normal, with σ = 1.87 mg/dl. (a) find a 95% confidence interval for the population mean concentration of uric acid in this patient's blood. what is the margin of error? (round your answers to two decimal places.) lower limit upper limit margin of error (b) what conditions are necessary for your calculations? (select all that apply.) σ is unknown n is large σ is known normal distribution of uric acid uniform distribution of uric acid (c) interpret your results in the context of this problem. there is not enough information to make an interpretation. the probability that this interval contains the true average uric acid level for this patient is 0.05. the probability that this interval contains the true average uric acid level for this patient is 0.95. there is a 95% chance that the confidence interval is one of the intervals containing the population average uric acid level for this patient. there is a 5% chance that the confidence interval is one of the intervals containing the population average uric acid level for this patient. (d) find the sample size necessary for a 95% confidence level with maximal margin of error e = 1.10 for the mean concentration of uric acid in this patient's blood. (round your answer up to the nearest whole number.) blood tests
Answers: 2
You know the right answer?
The line plots below show the number of students in each of Andre’s and Mandy’s classes at school. A...
Questions


Mathematics, 16.08.2020 14:01

Chemistry, 16.08.2020 14:01

Chemistry, 16.08.2020 14:01


