
Mathematics, 25.03.2021 20:50 rouchedavisin4
WILL GIVE 25 POINTS
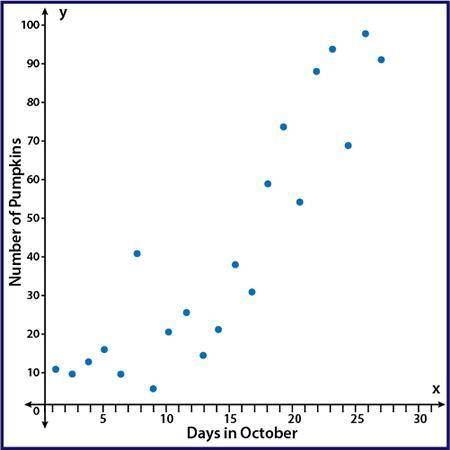
The scatter plot shows the number of pumpkins that have been picked on the farm during the month of October: A scatter plot with points showing an upward trend with points that are moderately spread out from a line of best fit. The y axis is labeled Number of Pumpkins and the x axis is labeled Days in October
Part A: Using computer software, a correlation coefficient of r = 0.51 was calculated. Based on the scatter plot, is that an accurate value for this data? Why or why not?
Part B: Instead of comparing the number of pumpkins picked and the day in October, write a scenario that would be a causal relationship for pumpkins picked on the farm.

Answers: 1

Another question on Mathematics
Mathematics, 21.06.2019 14:30
Shania's test scores in 8 subjects were 88, 91, 85, 74, 69, 72, 80, and 87. shania found the middle number of her scores. which type of measure did she find?
Answers: 1
Mathematics, 21.06.2019 17:00
The general form of the quetion of a circle is ax^2+by^2+cx+dy+e=0 where a=b=0 if the circle has a radius of three units and the center lies on the y axis which set of values of a, b, c, d, and e might correspond to the circle
Answers: 1
Mathematics, 21.06.2019 20:30
What is the best approximation for the area of a circle with a radius of 4 m ? use 3.14 to approximate pi
Answers: 1
You know the right answer?
WILL GIVE 25 POINTS
The scatter plot shows the number of pumpkins that have been picked on the farm...
Questions
Mathematics, 30.03.2021 05:50
Mathematics, 30.03.2021 06:00

Chemistry, 30.03.2021 06:00

Health, 30.03.2021 06:00

English, 30.03.2021 06:00

Business, 30.03.2021 06:00
Mathematics, 30.03.2021 06:00
English, 30.03.2021 06:00
English, 30.03.2021 06:00
Mathematics, 30.03.2021 06:00
Mathematics, 30.03.2021 06:00

Computers and Technology, 30.03.2021 06:00


