
Mathematics, 19.03.2021 22:40 rissa8227
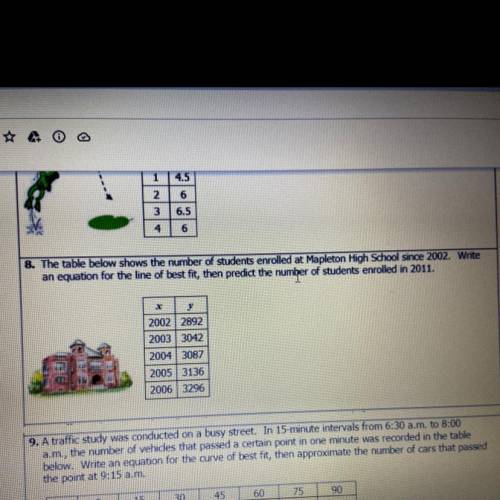
& The table below shows the number of students enrolled at Mapleton High School Since 2002. Write
an equation for the line of best fit, then predict the number of students enrolled in 2011.
2002 2892
2003 3042
20043087
2005 3136
2006 3296

Answers: 2
Another question on Mathematics
Mathematics, 21.06.2019 20:00
Pepe and leo deposits money into their savings account at the end of the month the table shows the account balances. if there pattern of savings continue and neither earns interest nor withdraw any of the money , how will the balance compare after a very long time ?
Answers: 1
Mathematics, 21.06.2019 20:30
You have a square piece of cardboard that measures 14 inches on each side. to build a box, you cut congruent squares out of each corner of the cardboard. use the picture to find the area of the cardboard you were used to build the box
Answers: 2
Mathematics, 21.06.2019 21:30
Name and describe the three most important measures of central tendency. choose the correct answer below. a. the mean, sample size, and mode are the most important measures of central tendency. the mean of a data set is the sum of the observations divided by the middle value in its ordered list. the sample size of a data set is the number of observations. the mode of a data set is its highest value in its ordered list. b. the sample size, median, and mode are the most important measures of central tendency. the sample size of a data set is the difference between the highest value and lowest value in its ordered list. the median of a data set is its most frequently occurring value. the mode of a data set is sum of the observations divided by the number of observations. c. the mean, median, and mode are the most important measures of central tendency. the mean of a data set is the product of the observations divided by the number of observations. the median of a data set is the lowest value in its ordered list. the mode of a data set is its least frequently occurring value. d. the mean, median, and mode are the most important measures of central tendency. the mean of a data set is its arithmetic average. the median of a data set is the middle value in its ordered list. the mode of a data set is its most frequently occurring value.
Answers: 3
Mathematics, 21.06.2019 22:40
Adeli owner keeps track of the to-go orders each day. the results from last saturday are shown in the given two-way frequency table. saturday's to-go deli orders in person by phone online total pick up 38 25 31 94 delivery 35 28 34 97 total 73 53 65 191 what percent of the to-go orders were delivery orders placed by phone? a. 14.66% b. 38.41% c. 28.87% d. 52.83%
Answers: 2
You know the right answer?
& The table below shows the number of students enrolled at Mapleton High School Since 2002. Writ...
Questions


Mathematics, 18.09.2019 01:30

Mathematics, 18.09.2019 01:30


Chemistry, 18.09.2019 01:30

Social Studies, 18.09.2019 01:30
Chemistry, 18.09.2019 01:30
History, 18.09.2019 01:30
History, 18.09.2019 01:30
Health, 18.09.2019 01:30
History, 18.09.2019 01:30
Social Studies, 18.09.2019 01:30


