
Mathematics, 19.03.2021 16:00 Alexis3456829
When the number of features p is large, there tends to be a deterioration in the performance of KNN and other approaches that perform prediction using only observations that are near the test observation for which a predi made. This phenomenon is known as the perform poorly when p is large. We will now investigate this curse ction must be curse of dimensionality, and it ties into the fact that non-parametric approaches often a. Suppose that we have e that we have a set of observations , each with measurements on p = 1 feature, X. We assume that X is distributed on [0, 1]. Associated with each observation is a response value.
A. Suppose that we st observ ation's response using only observations that are within 10% of the range of X wish to predict a te closest to that test observation. For instance we will use obs use to make the prediction? , in order to predict the response for a test observation with X 0.6 ervations in the range [0.55, 0.65]. On average, what fraction of the available observations will we
B. Now suppose that we have a set of observations, each with measurements on p- 2 niformly distributed on [O, 1] x [0, 1]. We wish to predict a test observation's response features, X1 and X2. We using only observations that are within 10% of the range of X, and within 10% of the range of test observation. For instance, in order to predict the response for a test observation with X0.6 X, 0.35, we will use observations in the range [0.55,0.65] for Xi and average, what fraction of the available observations will we use to make the prediction? X2 closest to that and in the range [0.3,0.4] for X2. On
C. Now suppose that we have a set of observations on p100 features. Again t he observations are uniformly . distributed on each feature, and again each feature ranges in value from 0 to 1. We wish to predict a test observation's response using observations within the 10% of each feature's range that is closest to that test observation. What fraction of the available observations will we use to make the prediction? D. Now suppose that we wish to make a prediction for a test observation by creating a p-dimensional hypercube centered around the test observation that contains, on average, 10% of the training observations. For p 1 2 and 100, what is the length of each side of the hypercube?

Answers: 2
Another question on Mathematics
Mathematics, 21.06.2019 19:30
Show your workcan a right triangle have this sides? *how to prove it without using the pythagorean theorema*
Answers: 2
Mathematics, 21.06.2019 20:50
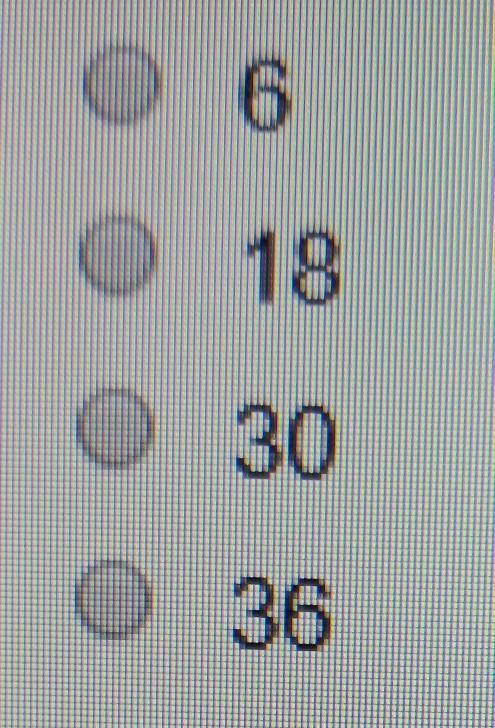
Determine the common ratio and find the next three terms of the geometric sequence. 649-14-02-00-00_files/i0100000, 649-14-02-00-00_files/i0100001, 2, a. 3; 649-14-02-00-00_files/i0100002, 649-14-02-00-00_files/i0100003, 649-14-02-00-00_files/i0100004. c. 649-14-02-00-00_files/i0100005; 649-14-02-00-00_files/i0100006, 649-14-02-00-00_files/i0100007, 649-14-02-00-00_files/i0100008. b. 3; 6, 18, 54 d. 649-14-02-00-00_files/i0100009. 6, 18, 54 select the best answer from the choices provided a b c d
Answers: 1
Mathematics, 21.06.2019 21:00
Aquadrilateral has exactly one pair of parallel sides. which name best describes the figure?
Answers: 3
Mathematics, 22.06.2019 01:40
Areflection of shape i across the y-axis, followed by a , and then a translation left 6 units and down 4 units confirms congruence between shape i and shape ii. alternatively, a of shape ii about the origin, followed by a reflection across the y-axis, and then a translation right 4 units and up 6 units confirms congruence between shape ii and shape i.
Answers: 3
You know the right answer?
When the number of features p is large, there tends to be a deterioration in the performance of KNN...
Questions


Mathematics, 05.05.2020 12:52
Mathematics, 05.05.2020 12:52


English, 05.05.2020 12:52
Mathematics, 05.05.2020 12:52
Mathematics, 05.05.2020 12:52


