
Mathematics, 18.03.2021 03:00 tdluong157
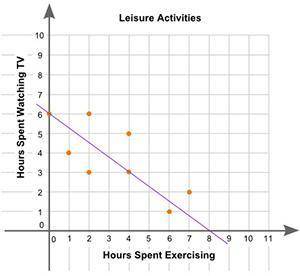
The scatter plot shows the relationship between the weekly hours of watching television and the weekly hours spent exercising, by the students of a high school:
A scatter plot is shown with the title Leisure Activities. The x-axis is labeled hours spent exercising, and the y-axis is labeled hours spent watching TV. Data points are located at 1 and 4, 2 and 6, 2 and 3, 4 and 3, 6 and 1, 4 and 5, 7 and 2, 0 and 6. A line connects the points 0 comma 6 and 8 comma 0.
What is the y-intercept of the line of best fit and what does it represent? (4 points)
a. 6 hours; the number of hours students exercise when they do not watch television
Selected:b. 6 hours; the number of hours students watch television when they do not exerciseThis answer is correct.
c. 8 hours; the number of hours students exercise when they do not watch television
d. 8 hours; the number of hours students watch television when they do not exercise

Answers: 1
Another question on Mathematics
Mathematics, 21.06.2019 16:30
Astandard american eskimo dog has a mean weight of 30 pounds with a standard deviation of 2 pounds. assuming the weights of standard eskimo dogs are normally distributed, what range of weights would 99.7% of the dogs have? approximately 26–34 pounds approximately 24–36 pounds approximately 28–32 pounds approximately 29–31 pounds
Answers: 1
Mathematics, 21.06.2019 18:30
Una caja de galletas contiene 16 paquetes y cada una de estas tiene 12 galletas y se quieren repartir entre 6 niños ¿de cuantas galletas le toca a cada niño?
Answers: 1
Mathematics, 21.06.2019 21:00
At oaknoll school, 90 out of 270 students on computers. what percent of students at oak knoll school do not own computers? round the nearest tenth of a percent.
Answers: 1
You know the right answer?
The scatter plot shows the relationship between the weekly hours of watching television and the week...
Questions

English, 07.10.2020 01:01
Mathematics, 07.10.2020 01:01

Arts, 07.10.2020 01:01
English, 07.10.2020 01:01
Mathematics, 07.10.2020 01:01


Mathematics, 07.10.2020 01:01
Mathematics, 07.10.2020 01:01
Mathematics, 07.10.2020 01:01
Mathematics, 07.10.2020 01:01

History, 07.10.2020 01:01


