
Mathematics, 18.03.2021 02:50 rontezmalcom36
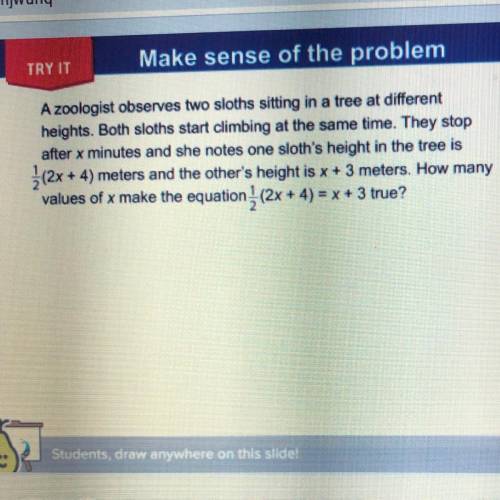
A zoologist observes two sloths sitting in a tree at different
heights. Both sloths start climbing at the same time. They stop
after x minutes and she notes one sloth's height in the tree is
2 (2x + 4) meters and the other's height is x + 3 meters. How many
values of x make the equation (2x + 4) = x + 3 true?

Answers: 1
Another question on Mathematics
Mathematics, 21.06.2019 15:00
Asmall foreign car gete 42 miles per gallon and user 35 gallons on a trip.gasoline costs $1.05 per gallon.what was the cost of gasoline per mile driver?
Answers: 3
Mathematics, 21.06.2019 16:00
Part one: measurements 1. measure your own height and arm span (from finger-tip to finger-tip) in inches. you will likely need some from a parent, guardian, or sibling to get accurate measurements. record your measurements on the "data record" document. use the "data record" to you complete part two of this project. name relationship to student x height in inches y arm span in inches archie dad 72 72 ginelle mom 65 66 sarah sister 64 65 meleah sister 66 3/4 67 rachel sister 53 1/2 53 emily auntie 66 1/2 66 hannah myself 66 1/2 69 part two: representation of data with plots 1. using graphing software of your choice, create a scatter plot of your data. predict the line of best fit, and sketch it on your graph. part three: the line of best fit include your scatter plot and the answers to the following questions in your word processing document 1. 1. which variable did you plot on the x-axis, and which variable did you plot on the y-axis? explain why you assigned the variables in that way. 2. write the equation of the line of best fit using the slope-intercept formula $y = mx + b$. show all your work, including the points used to determine the slope and how the equation was determined. 3. what does the slope of the line represent within the context of your graph? what does the y-intercept represent? 5. use the line of best fit to you to describe the data correlation.
Answers: 2
Mathematics, 21.06.2019 17:30
1. if we have 3 babies what is the probability they’re going to be all boys? 2. if we roll 2 die at the same time what is the probability of getting less than 10 on the first roll and a 5 on the second roll 3. if we have 3 babies what is the probability their is going to be 2 girls? 4. if we have 3 babies what is the probability of having no more than 1 girl? 5. it we have 3 babies and then have another 3 babies what is the probability of us having at least 1 boy and then having all girls?
Answers: 1
Mathematics, 21.06.2019 18:00
Carmen begins her next painting on a rectangular canvas that is 82.7 cm long and has a area of 8,137.68 cm2. will the painting fit in a frame with an opening that is 82.7 cm long and 95 cm wide? explain
Answers: 3
You know the right answer?
A zoologist observes two sloths sitting in a tree at different
heights. Both sloths start climbing...
Questions

Social Studies, 03.02.2020 18:43
Mathematics, 03.02.2020 18:43


History, 03.02.2020 18:43
Mathematics, 03.02.2020 18:43
Mathematics, 03.02.2020 18:43
Mathematics, 03.02.2020 18:43
Mathematics, 03.02.2020 18:43
History, 03.02.2020 18:43


History, 03.02.2020 18:43
Social Studies, 03.02.2020 18:43
Physics, 03.02.2020 18:43
History, 03.02.2020 18:43


