
Mathematics, 13.03.2021 05:50 tatemcgee
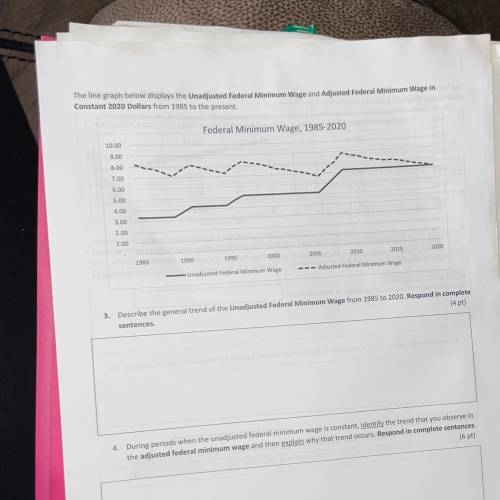
The line graph below displays the Unadjusted Federal Minimum Wage and Adjusted Federal Minimum Wage in
Constant 2020 Dollars from 1985 to the present.
Federal Minimum Wage, 1985-2020
10.00
9.00
8.00
7.00
6.00
5.00
4.00
3.00
2.00
100
2015
2020
2005
2010
2000
1995
1985
1990
--- Adjusted Federal Minimum Wage
-Unadjusted Federal Minimum Wage
3. Describe the general trend of the Unadjusted Federal Minimum Wage from 1985 to 2020. Respond in complete
sentences.
(4 pt)
4. During periods when the unadjusted federal minimum wage is constant, identify the trend that you observe in
the adjusted federal minimum wage and then explain why that trend occurs. Respond in complete sentences.
(6 pt)
175

Answers: 1
Another question on Mathematics
Mathematics, 21.06.2019 13:30
Patel’s class voted on their favorite color. patel plans to make a circle graph to display the results. which statements are true about the circle graph patel can create? check all that apply.
Answers: 2
Mathematics, 21.06.2019 23:00
Describe the end behavior of the function below. f(x)=(2/3)^x-2 a. as x increases, f(x) approaches infinity. b. as x decreases, f(x) approaches 2. c. as x increases, f(x) approaches -2. d. as x decreases, f(x) approaches negative infinity.
Answers: 1
Mathematics, 21.06.2019 23:00
Aremote-controlled boat can travel at 4 feet per second in calm water. the boat traveled 48 feet with the current, and then it traveled 16 feet against the current in the same amount of time. how fast is the current?
Answers: 1
You know the right answer?
The line graph below displays the Unadjusted Federal Minimum Wage and Adjusted Federal Minimum Wage...
Questions


English, 25.01.2021 20:30
Mathematics, 25.01.2021 20:30


Chemistry, 25.01.2021 20:30
Mathematics, 25.01.2021 20:30
Mathematics, 25.01.2021 20:30
Mathematics, 25.01.2021 20:30

Computers and Technology, 25.01.2021 20:30
Biology, 25.01.2021 20:30


