
Mathematics, 11.03.2021 09:20 gafsh272833
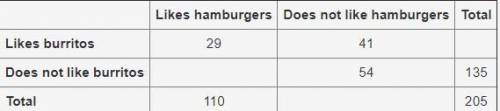
A food truck did a daily survey of customers to find their food preferences. The data is partially entered in the frequency table. Complete the table to analyze the data and answer the questions:
Likes hamburgers Does not like hamburgers Total
Likes burritos 29 41
Does not like burritos 54 135
Total 110 205
Part A: What percentage of the survey respondents do not like both hamburgers and burritos?
Part B: What is the marginal relative frequency of all customers that like hamburgers?
Part C: Use the conditional relative frequencies to determine which data point has strongest association of its two factors. Use complete sentences to explain your answer.
if you can, can you explain to me how you got the answer too? :)
this is what the table looks like

Answers: 3
Another question on Mathematics
Mathematics, 21.06.2019 19:30
Aline passes through 3,7 and 6,9 what equation represents the line
Answers: 2
Mathematics, 21.06.2019 22:30
Abucket of paint has spilled on a tile floor. the paint flow can be expressed with the function p(t) = 6(t), where t represents time in minutes and p represents how far the paint is spreading. the flowing paint is creating a circular pattern on the tile. the area of the pattern can be expressed as a(p) = 3.14(p)^2 part a: find the area of the circle of spilled paint as a function of time, or a[p(t)]. show your work. part b: how large is the area of spilled paint after 8 minutes? you may use 3.14 to approximate pi in this problem.
Answers: 2
Mathematics, 22.06.2019 03:10
Two groups of students were asked how many hours they spent reading each day. the table below shows the numbers for each group: group a 1 2 1 1 3 3 2 2 3 group b 3 2 3 2 2 2 1 1 2 based on the table, which of the following is true? the interquartile range for group a students is 0.5 less than the interquartile range for group b students. the interquartile range for group a students is equal to the interquartile range for group b students. the interquartile range for group a employees is 0.5 more than to the interquartile range for group b students. the interquartile range for group a employees is 1 more than the interquartile range for group b students.
Answers: 1
You know the right answer?
A food truck did a daily survey of customers to find their food preferences. The data is partially e...
Questions

Physics, 09.04.2021 18:40

Mathematics, 09.04.2021 18:40


Chemistry, 09.04.2021 18:40
Mathematics, 09.04.2021 18:40

Law, 09.04.2021 18:40


Biology, 09.04.2021 18:40
Mathematics, 09.04.2021 18:40
Biology, 09.04.2021 18:40


