Infant
у
22
20
*
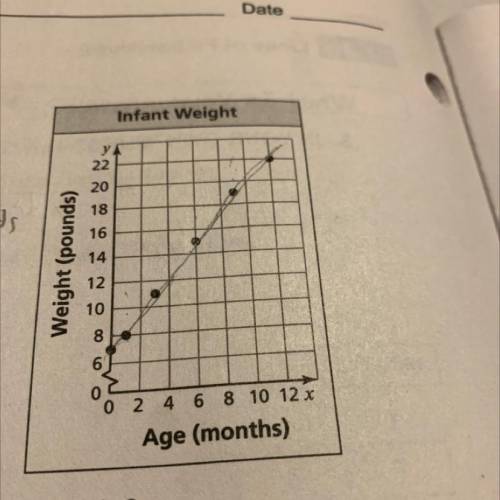
1. The scatter plot shows the weights y of an infant
...

Mathematics, 08.03.2021 07:00 23mwade
Infant
у
22
20
*
1. The scatter plot shows the weights y of an infant
from birth through x months.
a. At what age did the infant weigh 11 pounds?
b. What was the infant's weight at birth?
c. Draw a line that you think best approximates the points
d. Write an equation for your line.
e. Use the equation to predict the weight of the
infant at 18 months.
f. Does the data show a positive, a negative, or no relationship?

Answers: 2
Another question on Mathematics
Mathematics, 22.06.2019 03:30
In a coastal town, the humidity, measured in grams of water per kilogram of air, increases by 43% for every 1 degree celsius increase in temperature. a scientist observes that the humidity on monday morning is 5.75 grams per kilogram. he wants to know how much the temperature must increase for the humidity to reach at least 49.17 grams per kilogram. let t represent the increase in temperature, in degrees celsius, from monday morning's observation. write an inequality to represent the situation, and use it to determine the desired temperature increase.
Answers: 3
Mathematics, 22.06.2019 03:30
Ling is using fraction strips to add 2/3 and 7/12's the sum is one whole plus how many twelves?
Answers: 1
Mathematics, 22.06.2019 04:00
What is the answer to this problem? ignore the work. what is the correct answer?
Answers: 2
You know the right answer?
Questions
Mathematics, 20.10.2020 21:01

English, 20.10.2020 21:01
Mathematics, 20.10.2020 21:01

Spanish, 20.10.2020 21:01


Mathematics, 20.10.2020 21:01
Mathematics, 20.10.2020 21:01


Mathematics, 20.10.2020 21:01

History, 20.10.2020 21:01


