2 yd

Mathematics, 05.03.2021 21:00 doggylover6633
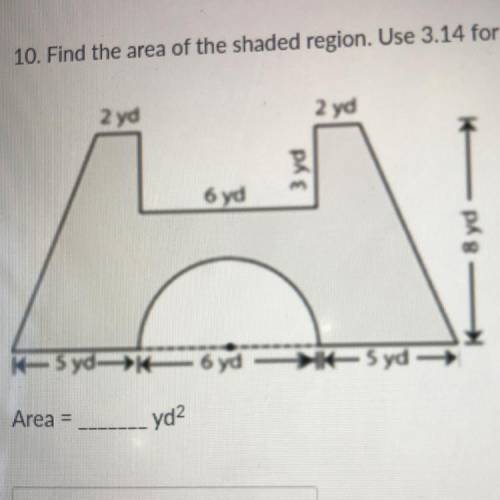
IM STRUGGLING SO BAD HELP ;-; Find the area of the shaded region. Use 3.14 for n.
2 yd
2 yd
3 yd
6 yd
-8 yd —
sydd syd
Syd →

Answers: 3
Another question on Mathematics
Mathematics, 20.06.2019 18:04
Which statement is always true? a negative exponent cannot be part of an expression's numerator. a negative base raised to the power of 2 has a negative value. a negative base raised to the power of 2 has a positive value. any number to the first power is zero.
Answers: 1
Mathematics, 21.06.2019 13:30
Akitchen floor is made up of tiles that are in the shape of the triangle shown there are 40 tiles on the kitchen floor what is the total area of the floor
Answers: 2
Mathematics, 21.06.2019 16:00
Part one: measurements 1. measure your own height and arm span (from finger-tip to finger-tip) in inches. you will likely need some from a parent, guardian, or sibling to get accurate measurements. record your measurements on the "data record" document. use the "data record" to you complete part two of this project. name relationship to student x height in inches y arm span in inches archie dad 72 72 ginelle mom 65 66 sarah sister 64 65 meleah sister 66 3/4 67 rachel sister 53 1/2 53 emily auntie 66 1/2 66 hannah myself 66 1/2 69 part two: representation of data with plots 1. using graphing software of your choice, create a scatter plot of your data. predict the line of best fit, and sketch it on your graph. part three: the line of best fit include your scatter plot and the answers to the following questions in your word processing document 1. 1. which variable did you plot on the x-axis, and which variable did you plot on the y-axis? explain why you assigned the variables in that way. 2. write the equation of the line of best fit using the slope-intercept formula $y = mx + b$. show all your work, including the points used to determine the slope and how the equation was determined. 3. what does the slope of the line represent within the context of your graph? what does the y-intercept represent? 5. use the line of best fit to you to describe the data correlation.
Answers: 2
Mathematics, 21.06.2019 17:00
How many of the 250 grandparents in the population would you expect to prefer online shopping with merchant a? merchant a: 4 merchant b: 6 merchant c: 2 merchant d: 3 other: 5 none: 5 answer choices: a.about 4 b.about 8 c.about 40 d.about 21
Answers: 1
You know the right answer?
IM STRUGGLING SO BAD HELP ;-; Find the area of the shaded region. Use 3.14 for n.
2 yd
2 yd
2 yd
Questions


Mathematics, 05.03.2021 23:20
Mathematics, 05.03.2021 23:20


Chemistry, 05.03.2021 23:20
Mathematics, 05.03.2021 23:20
Physics, 05.03.2021 23:20
Mathematics, 05.03.2021 23:20
Chemistry, 05.03.2021 23:20

History, 05.03.2021 23:20
Mathematics, 05.03.2021 23:20
Mathematics, 05.03.2021 23:20
Mathematics, 05.03.2021 23:20

English, 05.03.2021 23:20


