Which statement is not true about the data shown by the box plot below?
a.
The median of the...

Mathematics, 05.03.2021 19:40 sofyan00404
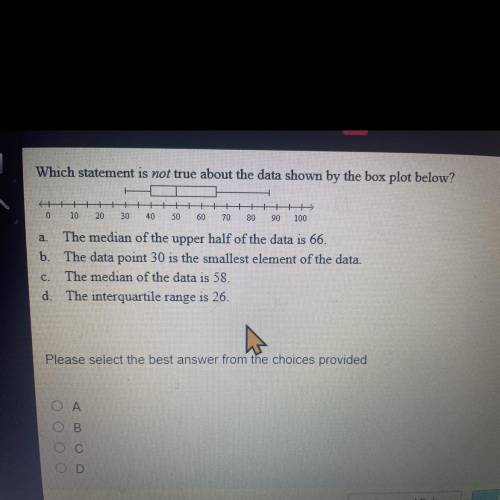
Which statement is not true about the data shown by the box plot below?
a.
The median of the upper half of the data is 66.
b. The data point 30 is the smallest element of the data.
C. The median of the data is 58.
d. The interquartile range is 26.

Answers: 2
Another question on Mathematics
Mathematics, 22.06.2019 02:50
The graph of f(x) shown below has the same shape as the graph of g(x)=x^3-x^2 but it is shifted to the left 2 units what is its equation
Answers: 2
Mathematics, 22.06.2019 05:00
Will reward u brainliest! a restaurant did a survey among 100 customers to find their food preferences. the customers were asked about their preferences for pasta or rice. out of the total 30 people who liked pasta, 10 liked rice also. there were 40 people who liked rice. ok so all i need is someone to fill these in: like pasta and rice: like pasta, do not like rice: do not like pasta, like rice: do not like pasta or rice:
Answers: 1
Mathematics, 22.06.2019 06:00
At the height of about 212 meters one shell square is the tallest building in new orleans marlin is creating a scale model of this building using the scale 250 meters = 1 meter to the nearest tenth of a meter what will be the height of the scale model
Answers: 2
You know the right answer?
Questions

Engineering, 31.03.2020 03:00


Mathematics, 31.03.2020 03:00

Mathematics, 31.03.2020 03:00
Mathematics, 31.03.2020 03:00
Social Studies, 31.03.2020 03:01
Mathematics, 31.03.2020 03:01


Physics, 31.03.2020 03:01
History, 31.03.2020 03:01


