
Mathematics, 05.03.2021 14:00 melissapulido198
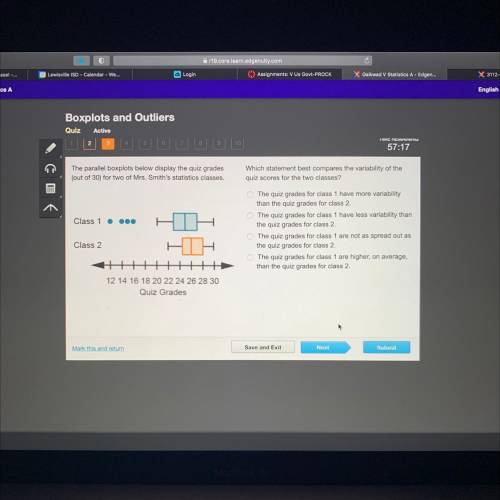
The parallel boxplots below display the quiz grades
(out of 30) for two of Mrs. Smith's statistics classes.
Which statement best compares the variability of the
quiz scores for the two classes?
Class 1 000
O The quiz grades for class 1 have more variability
than the quiz grades for class 2.
The quiz grades for class 1 have less variability than
the quiz grades for class 2.
The quiz grades for class 1 are not as spread out as
the quiz grades for class 2.
O The quiz grades for class 1 are higher, on average,
than the quiz grades for class 2.
Class 2
+
12 14 16 18 20 22 24 26 28 30
Quiz Grades

Answers: 3
Another question on Mathematics
Mathematics, 21.06.2019 15:00
In which figure is de bc ? a. figure 1 b. figure 2 c. figure 3 d. figure 4
Answers: 1
Mathematics, 21.06.2019 16:50
The vertices of a triangle are a(7,5), b(4,2), c(9,2). what is m
Answers: 2
Mathematics, 21.06.2019 22:00
Rewrite so the subject can be y in the formula d=m-y/y+n
Answers: 1
Mathematics, 21.06.2019 22:50
On the first of each month sasha runs a 5k race she keeps track of her times to track her progress her time in minutes is recorded in the table
Answers: 1
You know the right answer?
The parallel boxplots below display the quiz grades
(out of 30) for two of Mrs. Smith's statistics...
Questions
Mathematics, 08.03.2021 20:40

History, 08.03.2021 20:40

Spanish, 08.03.2021 20:40


English, 08.03.2021 20:40
Mathematics, 08.03.2021 20:40
Physics, 08.03.2021 20:40
Mathematics, 08.03.2021 20:40

Physics, 08.03.2021 20:40

Mathematics, 08.03.2021 20:40

Chemistry, 08.03.2021 20:40
Arts, 08.03.2021 20:40
Chemistry, 08.03.2021 20:40


