
Mathematics, 28.02.2021 17:10 allysongonzalezlove0
A manufacturer of cheese filled ravioli supplies a pizza restaurant chain. Based on data collected
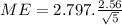
from its automatic filling process, the amount of cheese inserted into the ravioli is normally distributed. To make sure that the automatic filling process is on target, quality control inspectors take a sample of 25 ravioli with mean weight of 15.26 grams and standard deviation of 2.56 grams. The margin of error (ME) to construct a 99% confidence interval for the true mean amount of cheese filling is
A) 2.064 B) 1.432 C) 3.745 D) 1.276 E) 1.797
b. A manufacturer of cheese filled ravioli supplies a pizza restaurant chain. Based on data collected
from its automatic filling process, the amount of cheese inserted into the ravioli is normally distributed. To make sure that the automatic filling process is on target, quality control inspectors take a sample of 25 ravioli and measure the weight of cheese filling. They find the 99% confidence interval of 14.16 to 15.84 grams. Which of the following is the correct interpretation?
I. We are 99% confident that the mean weight of cheese filling in all ravioli made by this process is between 14.16 and 15.84 grams.
II. 99% of all ravioli made by this process will have cheese filling weights between 14.16 and 15.84 grams.
III. We are 99% confident that the interval (14.16, 15.84) contains the mean weight of cheese filling in all ravioli made by this process.
IV. The weight of cheese filling in the ravioli is between 14.16 and 15.84 grams 99% of the time.
A) I only
B) III only
C)I and III.
D) II and III
E) I and IV

Answers: 1

 ;
;
Another question on Mathematics
Mathematics, 22.06.2019 01:20
1. why is a frequency distribution useful? it allows researchers to see the "shape" of the data. it tells researchers how often the mean occurs in a set of data. it can visually identify the mean. it ignores outliers. 2. the is defined by its mean and standard deviation alone. normal distribution frequency distribution median distribution marginal distribution 3. approximately % of the data in a given sample falls within three standard deviations of the mean if it is normally distributed. 95 68 34 99 4. a data set is said to be if the mean of the data is greater than the median of the data. normally distributed frequency distributed right-skewed left-skewed
Answers: 2
Mathematics, 22.06.2019 01:30
Pllz me also i will report if you are in for the 1. complete the table by converting each decimal to a fraction. repeating decimals. 0.31 0.125 0.1607 2. describe any patterns you noticed when converting the decimals in the table above.
Answers: 1
You know the right answer?
A manufacturer of cheese filled ravioli supplies a pizza restaurant chain. Based on data collected...
Questions


Chemistry, 02.10.2019 17:30

Social Studies, 02.10.2019 17:30
Biology, 02.10.2019 17:30

Mathematics, 02.10.2019 17:30
Mathematics, 02.10.2019 17:30
Mathematics, 02.10.2019 17:30


Health, 02.10.2019 17:30
History, 02.10.2019 17:30

Mathematics, 02.10.2019 17:30
English, 02.10.2019 17:30
History, 02.10.2019 17:30
Mathematics, 02.10.2019 17:30


