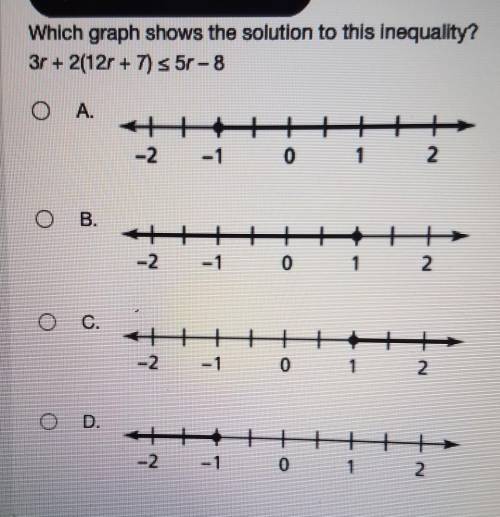
Which graph shows the solution to this inequality? 3r+2(12r+7) ≤ 5r-8
...

Mathematics, 26.02.2021 23:50 Caixiayang3613
Which graph shows the solution to this inequality? 3r+2(12r+7) ≤ 5r-8

Answers: 1
Another question on Mathematics
Mathematics, 21.06.2019 17:00
An airplane consumes fuel at a constant rate while flying through clear skies, and it consumes fuel at a rate of 64 gallons per minute while flying through rain clouds. let c represent the number of minutes the plane can fly through clear skies and r represent the number of minutes the plane can fly through rain clouds without consuming all of its fuel. 56c+64r < 900056c+64r< 9000 according to the inequality, at what rate does the airplane consume fuel while flying through clear skies, and how much fuel does it have before takeoff? the airplane consumes fuel at a rate of gallons per minute while flying through clear skies, and it has gallons of fuel before takeoff. does the airplane have enough fuel to fly for 60 minutes through clear skies and 90 minutes through rain clouds?
Answers: 3
Mathematics, 21.06.2019 18:30
For this option, you will work individually. the pythagorean theorem can be used in many real-world scenarios. part 1 write your own real-world scenario where the pythagorean theorem can be applied to find a missing piece. you may choose to write a problem that is two- or three-dimensional in nature. be sure that you will be able to draw a diagram of your scenario. write out your problem and submit it for part 1. be sure to end your scenario with a question. part 2 draw a diagram of the scenario you created in part 1. you may draw by hand and scan and upload your drawing or create a computer-generated drawing for submission. be sure to label all parts and dimensions of the drawing. part 3 solve the question that you posed in part 1. show all of your steps in answering the question. for this option, you will need to submit all three parts for full credit—your real-world problem and question, the diagram that you created, and your work solving the problem, showing all steps. * note that your instructor is looking for your own original idea. while it is acceptable to use the internet for research and inspiration, academic integrity policies apply.
Answers: 1
Mathematics, 22.06.2019 01:30
Have you ever been in the middle of telling a story and had to use hand gestures or even a drawing to make your point? in algebra, if we want to illustrate or visualize a key feature of a function, sometimes we have to write the function in a different form—such as a table, graph, or equation—to determine the specific key feature we’re looking for. think about interactions with others and situations you’ve come across in your own life. how have you had to adjust or change the way you represented something based on either the concept you were trying to describe or the person you were interacting with? explain how the complexity or layout of the concept required you to change your style or presentation, or how the person’s unique learning style affected the way you presented the information.
Answers: 1
Mathematics, 22.06.2019 04:30
Imade a beaded necklace that was 2/6 blue, 3/5 green and the rest were white. did the necklace have more blue or green how many white beads did it have.
Answers: 1
You know the right answer?
Questions


English, 27.07.2019 01:00

Social Studies, 27.07.2019 01:00


Mathematics, 27.07.2019 01:00

World Languages, 27.07.2019 01:00
Health, 27.07.2019 01:00

Physics, 27.07.2019 01:00

Arts, 27.07.2019 01:00


