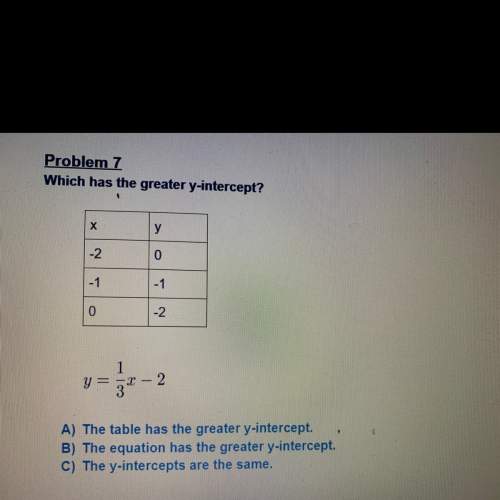
The pie chart shows how 36 pupils travel to school.
Use the pie chart to complete the table.
...

Mathematics, 26.02.2021 19:20 desiree98
The pie chart shows how 36 pupils travel to school.
Use the pie chart to complete the table.
Submit
Bike
Walk
Travel to
school
Number
of pupils
Walk
Car
120
Bus
Bus
Car
Bike
Total
36
Question Feedback

Answers: 1
Another question on Mathematics
Mathematics, 21.06.2019 16:30
Astandard american eskimo dog has a mean weight of 30 pounds with a standard deviation of 2 pounds. assuming the weights of standard eskimo dogs are normally distributed, what range of weights would 99.7% of the dogs have? approximately 26–34 pounds approximately 24–36 pounds approximately 28–32 pounds approximately 29–31 pounds
Answers: 1
Mathematics, 21.06.2019 17:40
Divide. reduce the answer to lowest terms.5 2/3 ÷ 3 1/9
Answers: 3
Mathematics, 21.06.2019 21:30
50 plz, given the system of equations, match the following items. x + 3 y = 5 x - 3 y = -1 a) x-determinant b) y-determinant c) system determinant match the following to the pictures below.
Answers: 2
Mathematics, 21.06.2019 22:50
Listed below are time intervals (min) between eruptions of a geyser. assume that the "recent" times are within the past few years, the "past" times are from around 20 years ago, and that the two samples are independent simple random samples selected from normally distributed populations. do not assume that the population standard deviations are equal. does it appear that the mean time interval has changed? is the conclusion affected by whether the significance level is 0.10 or 0.01? recent 78 90 90 79 57 101 62 87 71 87 81 84 57 80 74 103 62 past 88 89 93 94 65 85 85 92 87 91 89 91 follow the steps of hypothesis testing, including identifying the alternative and null hypothesis, calculating the test statistic, finding the p-value, and making a conclusions about the null hypothesis and a final conclusion that addresses the original claim. use a significance level of 0.10. is the conclusion affected by whether the significance level is 0.10 or 0.01? answer choices below: a) yes, the conclusion is affected by the significance level because h0 is rejected when the significance level is 0.01 but is not rejected when the significance level is 0.10. b) no, the conclusion is not affected by the significance level because h0 is not rejected regardless of whether a significance level of 0.10 or 0.01 is used. c) yes, the conclusion is affected by the significance level because h0 is rejected when the significance level is 0.10 but is not rejected when the significance level is 0.01. d) no, the conclusion is not affected by the significance level because h0 is rejected regardless of whether a significance level of 0.10 or 0.01 is used.
Answers: 3
You know the right answer?
Questions
Mathematics, 08.02.2021 01:50
Mathematics, 08.02.2021 01:50
Mathematics, 08.02.2021 01:50
Mathematics, 08.02.2021 01:50


Mathematics, 08.02.2021 01:50

Chemistry, 08.02.2021 01:50

Social Studies, 08.02.2021 01:50


History, 08.02.2021 01:50


