
Mathematics, 25.02.2021 08:20 tiffanyheist
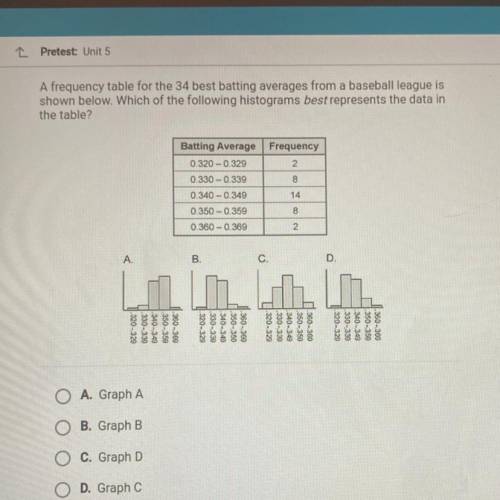
A frequency table for the 34 best batting averages from a baseball league is
shown below. Which of the following histograms best represents the data in
the table?
Frequency
2
Batting Average
0.320 -0.329
0.330 -0.339
0.340 -0.349
0.350 - 0.359
0.360 -0.369
0000
A.
B.
C.
.320-329
-330-339
1.340-349
.350-350
360-360
320-329
:330-339
.340-349
.350-359
.360-360
.320-329
-330-339
.340-349
.350 - 350
.360-360
-320-320
.330-339
340-349
350-350
.360-369
A. Graph A
B. Graph B
C. Graph D
O D. Graph C

Answers: 1
Another question on Mathematics
Mathematics, 21.06.2019 18:50
Astudent draws two parabolas on graph paper. both parabolas cross the x-axis at (-4, 0) and (6,0). the y-intercept of thefirst parabola is (0, –12). the y-intercept of the second parabola is (0-24). what is the positive difference between the avalues for the two functions that describe the parabolas? write your answer as a decimal rounded to the nearest tenth.
Answers: 2
Mathematics, 21.06.2019 19:00
Atriangle has a side lengths of 18cm, 80 cm and 81cm. classify it as acute obtuse or right?
Answers: 2
Mathematics, 21.06.2019 20:10
In the diagram, points d and e are marked by drawing arcs of equal size centered at b such that the arcs intersect ba and bc. then, intersecting arcs of equal size are drawn centered at points d and e. point p is located at the intersection of these arcs. based on this construction, m , and m
Answers: 1
You know the right answer?
A frequency table for the 34 best batting averages from a baseball league is
shown below. Which of...
Questions

English, 03.12.2021 08:40
Mathematics, 03.12.2021 08:40
English, 03.12.2021 08:40


History, 03.12.2021 08:40

Mathematics, 03.12.2021 08:50
Mathematics, 03.12.2021 08:50
Mathematics, 03.12.2021 08:50


English, 03.12.2021 08:50
History, 03.12.2021 08:50
Mathematics, 03.12.2021 08:50


