
Mathematics, 25.02.2021 02:40 lexie223
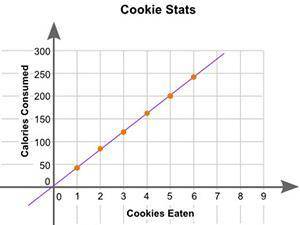
The graph shows the number of cookies eaten and the number of calories consumed:
A scatter plot is shown with the title cookie stats. The x-axis is labeled cookies eaten, and the y-axis is labeled calories consumed. Data points are located at 1 and 40, 2 and 80, 3 and 120, 4 and 160, 5 and 200, and 6 and 240. A line of best fit connects the points 1 and 40 to 6 and 240.
Which statement best describes the relationship between the number of cookies eaten and the number of calories consumed? (4 points)
a
No relationship can be determined.
b
As the number of cookies eaten increases, the calories consumed decreases.
c
As the number of cookies eaten increases, the calories consumed increases.
d
As the number of cookies eaten decreases, the calories consumed increases.

Answers: 3
Another question on Mathematics
Mathematics, 21.06.2019 16:00
What are the related frequencies to the nearest hundredth of the columns of the two way table? group 1: a-102 b-34group 2: a-18 b-14edited: i don’t have all day to be waiting for an answer. i figured it out.
Answers: 2
Mathematics, 21.06.2019 21:50
What is the 17th term in the arithmetic sequence in which a6 is 101 and a9 is 83
Answers: 3
Mathematics, 22.06.2019 00:30
You eat $0.85 for every cup of hot chocolate you sell. how many cups do you need to sell to earn $55.25
Answers: 2
Mathematics, 22.06.2019 04:00
Will positive numbers always have a higher absolute value than negative numbers?
Answers: 1
You know the right answer?
The graph shows the number of cookies eaten and the number of calories consumed:
A scatter plot is...
Questions

Physics, 26.01.2021 07:20
Mathematics, 26.01.2021 07:20

History, 26.01.2021 07:20
Mathematics, 26.01.2021 07:20

Social Studies, 26.01.2021 07:20
Mathematics, 26.01.2021 07:20

English, 26.01.2021 07:20

Mathematics, 26.01.2021 07:20
English, 26.01.2021 07:20
Chemistry, 26.01.2021 07:20
Mathematics, 26.01.2021 07:20
English, 26.01.2021 07:20
English, 26.01.2021 07:20
Chemistry, 26.01.2021 07:20

Biology, 26.01.2021 07:20


