PLEASE HELP ME!!
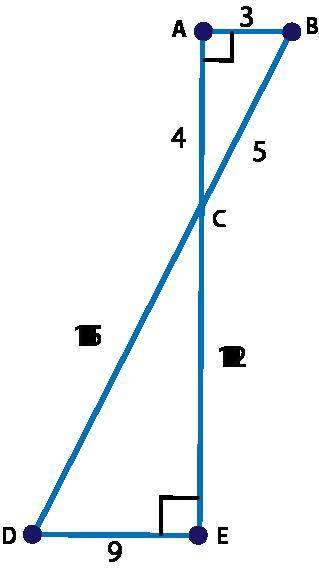
Prove that ΔABC and ΔEDC are similar.
15 over 5 equals 12 over 4 equal...

Mathematics, 23.02.2021 21:20 alee885
PLEASE HELP ME!!
Prove that ΔABC and ΔEDC are similar.
15 over 5 equals 12 over 4 equals 9 over 3, shows the corresponding sides are proportional; therefore, ΔABC ~ ΔEDC by the SSS Similarity Postulate.
∠DCE is congruent to ∠CBA by the Vertical Angles Theorem and 15 over 5 equals 12 over 4 shows the corresponding sides are proportional; therefore, ΔABC ~ ΔEDC by the SSS Similarity Postulate.
∠E and ∠B are right angles and, therefore, congruent since all right angles are congruent. 9 over 4 and 12 over 3 shows the corresponding sides are proportional; therefore, ΔABC ~ ΔEDC by the SAS Similarity Postulate.
15 over 4 equals 12 over 5 equals 9 over 3 shows the corresponding sides are proportional; therefore, ΔABC ~ ΔEDC by the SAS Similarity Postulate.

Answers: 1
Another question on Mathematics
Mathematics, 21.06.2019 16:00
Part one: measurements 1. measure your own height and arm span (from finger-tip to finger-tip) in inches. you will likely need some from a parent, guardian, or sibling to get accurate measurements. record your measurements on the "data record" document. use the "data record" to you complete part two of this project. name relationship to student x height in inches y arm span in inches archie dad 72 72 ginelle mom 65 66 sarah sister 64 65 meleah sister 66 3/4 67 rachel sister 53 1/2 53 emily auntie 66 1/2 66 hannah myself 66 1/2 69 part two: representation of data with plots 1. using graphing software of your choice, create a scatter plot of your data. predict the line of best fit, and sketch it on your graph. part three: the line of best fit include your scatter plot and the answers to the following questions in your word processing document 1. 1. which variable did you plot on the x-axis, and which variable did you plot on the y-axis? explain why you assigned the variables in that way. 2. write the equation of the line of best fit using the slope-intercept formula $y = mx + b$. show all your work, including the points used to determine the slope and how the equation was determined. 3. what does the slope of the line represent within the context of your graph? what does the y-intercept represent? 5. use the line of best fit to you to describe the data correlation.
Answers: 2
Mathematics, 21.06.2019 17:20
Researchers were interested in whether relaxation training decreases the number of headaches a person experiences. they randomly assigned 20 participants to a control group or a relaxation training group and noted the change in number of headaches each group reported from the week before training to the week after training. which statistical analysis should be performed to answer the researchers' question?
Answers: 2
Mathematics, 21.06.2019 22:40
20.ju inces. which ordered pair is a viable solution if x represents the number of books he orders and y represents the total weight of the books, in ounces? (-3,-18) (-0.5, -3) (0,0) (0.5, 3)
Answers: 1
Mathematics, 21.06.2019 23:00
During a wright loss challenge your friend goes from 125 pounds to 100 pounds.what was the percent weight loss
Answers: 2
You know the right answer?
Questions

Mathematics, 20.04.2021 22:20


English, 20.04.2021 22:20
English, 20.04.2021 22:20

Biology, 20.04.2021 22:20
Mathematics, 20.04.2021 22:20

Physics, 20.04.2021 22:20
Physics, 20.04.2021 22:20
Mathematics, 20.04.2021 22:20
Mathematics, 20.04.2021 22:20
History, 20.04.2021 22:20


