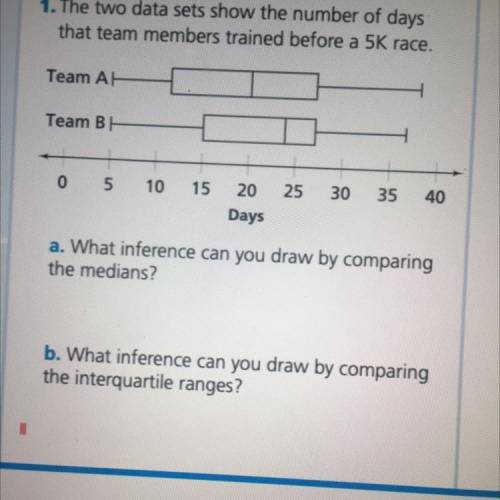
1. The two data sets show the number of days
that team members trained before a 5K race.
Team...

Mathematics, 22.02.2021 20:30 trippie4life
1. The two data sets show the number of days
that team members trained before a 5K race.
Team A
Team B
0 5 10 15 20 25 30 35 40
Days
a. What inference can you draw by comparing
the medians?
b. What inference can you draw by comparing
the interquartile ranges?

Answers: 1
Another question on Mathematics
Mathematics, 20.06.2019 18:04
If a fair 6 sided cube is rolled 60 times, theoretically how many times should you expect to roll a 4 or a 5?
Answers: 1
Mathematics, 22.06.2019 00:30
(c) a vine called the mile-a-minute weed is known for growing at a very fast rate. it can grow up to 0.5 ft per day. how fast in inches per hour can the mile-a-minute weed grow up to? show your work using the correct conversion factors.
Answers: 1
Mathematics, 22.06.2019 01:30
Atriangle has side lengths of x, x+11, and 3x+5. what is the perimeter? question 1 options: 3x2+38x+55 3x3+38x2+55x 5x+16 4x+16
Answers: 2
You know the right answer?
Questions


Mathematics, 21.04.2020 04:23


Arts, 21.04.2020 04:23

Chemistry, 21.04.2020 04:23
Mathematics, 21.04.2020 04:23
Arts, 21.04.2020 04:23
Mathematics, 21.04.2020 04:23


