
Mathematics, 18.02.2021 20:10 samm2002
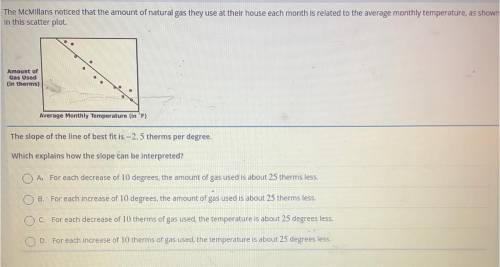
The McMillians noticed that the amount of natural gas they use at their house each month is related to the average monthly temperature, as shown in this scatter plot. The slope of the line best fit -2.5 therms per degree. Which explains how the slope can be interpreted? (PLEASE HELP ME, i don’t understand it!)

Answers: 2

Another question on Mathematics
Mathematics, 21.06.2019 21:00
Rewrite the following quadratic functions in intercept or factored form. show your work. y = 9 + 12x + 4x^2
Answers: 2
Mathematics, 21.06.2019 21:00
Adesigner charges a one time fee of $200 plus $40 an hour for each project. write an expression to represent how much money the designer will make for a project
Answers: 1
You know the right answer?
The McMillians noticed that the amount of natural gas they use at their house each month is related...
Questions


Computers and Technology, 26.07.2019 02:30
Mathematics, 26.07.2019 02:30


