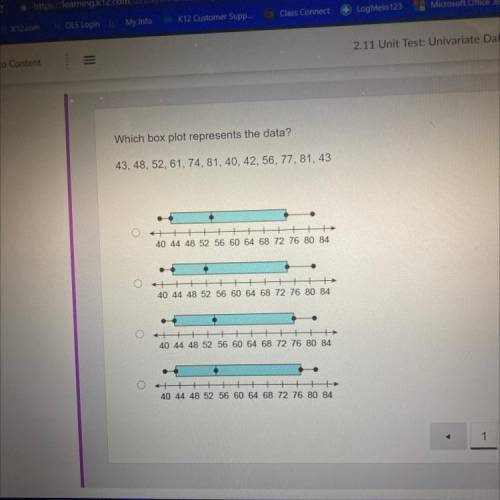
Which box plot represents the data?
43, 48, 52, 61, 74, 81, 40, 42, 56, 77, 81, 43
40 44 48 5...

Mathematics, 17.02.2021 05:10 angel13sigala
Which box plot represents the data?
43, 48, 52, 61, 74, 81, 40, 42, 56, 77, 81, 43
40 44 48 52 56 60 64 68 72 76 80 84
40 44 48 52 56 60 64 68 72 76 80 84
40 44 48 52 56 60 64 68 72 76 80 84
+++
40 44 48 52 56 60 64 68 72 76 80 84

Answers: 2
Another question on Mathematics
Mathematics, 21.06.2019 12:30
Write the equation below the represents the line passing through the point (-3, -1) negative one with a slope of 4
Answers: 2
Mathematics, 21.06.2019 19:00
Witch represents the inverse of the function f(x)=1/4x-12
Answers: 1
Mathematics, 21.06.2019 22:30
Whats are the trickiest steps to do when adding or subtracting rational expressions? how does knowledge of rational numbers u in adding and subtracting rational expressions?
Answers: 2
Mathematics, 21.06.2019 23:00
Answer this two poles, ab and ed, are fixed to the ground with the of ropes ac and ec, as shown: two right triangles abc and edc have a common vertex c. angle abc and edc are right angles. ab is labeled 13 feet, ac is labeled 15 feet, ec is labeled 10 feet, and ed is labeled 4 feet.what is the approximate distance, in feet, between the two poles? 11.14 feet16.65 feet14.35 feet15.59 feet
Answers: 1
You know the right answer?
Questions


Mathematics, 10.02.2020 13:08

Spanish, 10.02.2020 13:08

English, 10.02.2020 13:09
Chemistry, 10.02.2020 13:09

Computers and Technology, 10.02.2020 13:10

Geography, 10.02.2020 13:11
Mathematics, 10.02.2020 13:14

World Languages, 10.02.2020 13:29
Computers and Technology, 10.02.2020 13:30
Mathematics, 10.02.2020 13:31
English, 10.02.2020 13:34
Mathematics, 10.02.2020 13:36


