
Mathematics, 16.02.2021 09:00 awkwardkid0123
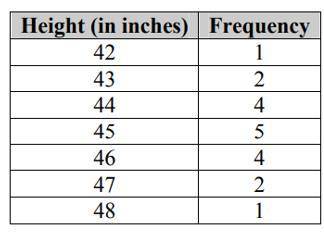
Mr Storer, the physical education teacher, measured the height of each student in his firsts period class. He organized his data in this chart below.
a. Make a dot plot for the data.
b. Make a histogram for the data.
c. Make a box plot for the data.
d. Does the distribution of heights appear normal/ bell-shaped?

Answers: 3
Another question on Mathematics
Mathematics, 21.06.2019 15:00
This week, conrad will work 1 3/4 times longer than last week. giovanni will work 1 1/3 times longer than last week. sally will work 2/3 the number of hours she worked last week. match each employee's name to the number of hours he or she will work this week
Answers: 1
Mathematics, 21.06.2019 19:30
Si la base de un triángulo isósceles mide 70 m y el ángulo opuesto a ésta mide 58°; entonces ¿cuánto mide la altura de dicho triángulo? a) 21.87 m. b) 40.01 m. c) 43.74 m. d) 63.14 m.
Answers: 1
Mathematics, 21.06.2019 20:10
Acolony contains 1500 bacteria. the population increases at a rate of 115% each hour. if x represents the number of hours elapsed, which function represents the scenario? f(x) = 1500(1.15)" f(x) = 1500(115) f(x) = 1500(2.15) f(x) = 1500(215)
Answers: 3
Mathematics, 21.06.2019 22:20
The coordinates of vortex a’ are (8,4) (-4,2) (4,-,4) the coordinates of vortex b’ are (6,6)(12,-,12)(12,12) the coordinates of vortex c’ are(-2,,12)(4,12)(12,-4)
Answers: 3
You know the right answer?
Mr Storer, the physical education teacher, measured the height of each student in his firsts period...
Questions
Mathematics, 16.04.2022 19:20

English, 16.04.2022 20:20

Mathematics, 16.04.2022 20:30


Business, 16.04.2022 21:10


English, 16.04.2022 21:30
Mathematics, 16.04.2022 21:40
Geography, 16.04.2022 21:50


