
Mathematics, 13.02.2021 09:40 oscarruiz
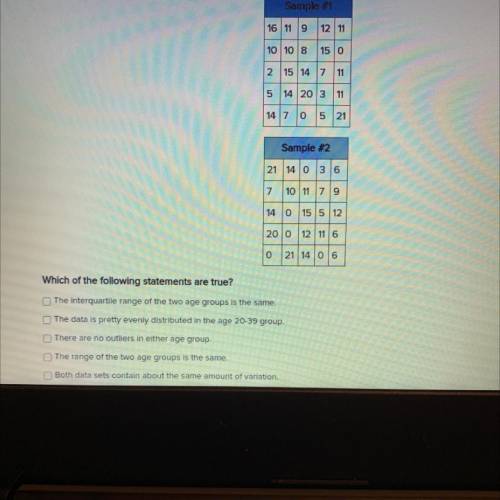
Two random samples of 25 people were asked how many 12 ounce cans of soda they consume each week. The first sample contains both males and females, aged 12 through 19. The second sample contains both males and females, age 20 to 39. The results are shown in the table below. Which of the following statements are true? The interquartile range of the two age groups of the same. The data is pretty evenly distributed in the age 20-39 group. there are no outliers in either age group. The range of the two age groups is the same. Both data sets contain about the same amount of variation.

Answers: 3
Another question on Mathematics
Mathematics, 21.06.2019 16:00
Find the area and perimeter of each composite figure. use 3.14 for π. round your answer to the nearest tenth. a square and a right triangle share a common side. image long description a 3-meter by 0.5-meter rectangle has triangles attached like wings to the 3-meter sides. the other two sides of both triangles measure 2.5 meters. the height of each triangle is 2 meters. a 6-inch by 4-inch rectangle has 2 half-circles attached like wings to the 6-inch sides. the radius of each half-circle is 3 inches. find the surface area and volume of each figure. use 3.14 for π. round your answer to the nearest tenth. a right circular cylinder has a base radius of 6 yards and a height of 20 yards. a rectangular prism has a base that is 9 centimeters long and 7 centimeters wide. the height is 2 centimeters. a rectangular prism has a base that measures 11 millimeters by 11 millimeters. the height is 11 millimeters.
Answers: 1
Mathematics, 21.06.2019 19:30
Asquare picture with sides of 32 inches is to be mounted on a square mat with sides of 52 inches. find the area of the mat that will remain uncovered by the picture.
Answers: 1
Mathematics, 21.06.2019 20:50
An automobile assembly line operation has a scheduled mean completion time, μ, of 12 minutes. the standard deviation of completion times is 1.6 minutes. it is claimed that, under new management, the mean completion time has decreased. to test this claim, a random sample of 33 completion times under new management was taken. the sample had a mean of 11.2 minutes. assume that the population is normally distributed. can we support, at the 0.05 level of significance, the claim that the mean completion time has decreased under new management? assume that the standard deviation of completion times has not changed.
Answers: 3
You know the right answer?
Two random samples of 25 people were asked how many 12 ounce cans of soda they consume each week. Th...
Questions

Social Studies, 27.08.2019 20:00

Mathematics, 27.08.2019 20:00
Social Studies, 27.08.2019 20:00
Social Studies, 27.08.2019 20:00
Mathematics, 27.08.2019 20:00
Mathematics, 27.08.2019 20:00

Physics, 27.08.2019 20:00

Biology, 27.08.2019 20:00

World Languages, 27.08.2019 20:00
Biology, 27.08.2019 20:00

Health, 27.08.2019 20:00

Business, 27.08.2019 20:00

History, 27.08.2019 20:00
Mathematics, 27.08.2019 20:00


