
Mathematics, 08.02.2021 19:30 shannaslaughter28
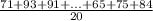
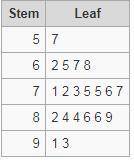
The test scores on a 100-point test were recorded for 20 students:71 93 91 86 7573 86 82 76 5784 89 67 62 7277 68 65 75 84a. Can you reasonably assume that these test scores have been selected from a normal population? Use a stem and leaf plot to justify your answer. b. Calculate the mean and standard deviation of the scores. c. If these students can be considered a random sample from the population of all students, find a 95% confidence interval for the average test score in he population.

Answers: 2

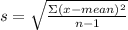
![s=\sqrt{\frac{[(71-76.65)+(93-76.65)+...+(84-76.65)]^{2}}{20-1} }](/tpl/images/1101/6407/3bfcc.png)


Another question on Mathematics
Mathematics, 21.06.2019 17:00
The table below shows the height of a ball x seconds after being kicked. what values, rounded to the nearest whole number, complete the quadratic regression equation that models the data? f(x) = x2 + x + 0based on the regression equation and rounded to the nearest whole number, what is the estimated height after 0.25 seconds? feet
Answers: 2
Mathematics, 21.06.2019 19:30
You have learned about the six trigonometric functions, their definitions, how to use them, and how to represent them graphically. the sine, cosine, and tangent trigonometric functions can be paired with their reciprocal functions, cosecant, secant, and cotangent, respectively. think about how each function is related to its reciprocal function.how are the graphs of the reciprocal functions related to their corresponding original functions? what happens to the graphs of the reciprocal functions as x approaches the zeros of the original functions? describe how you would teach friends with different learning styles (visual-spatial, aural-auditory, verbal-linguistic, physical-bodily-kinesthetic, logical-mathematical, social-interpersonal, and solitary-intrapersonal) how to graph the reciprocal functions
Answers: 2
Mathematics, 21.06.2019 20:00
In one day there are too high tides into low tides and equally spaced intervals the high tide is observed to be 6 feet above the average sea level after six hours passed a low tide occurs at 6 feet below the average sea level in this task you will model this occurrence using a trigonometric function by using x as a measurement of time assume the first high tide occurs at x=0. a. what are the independent and dependent variables? b. determine these key features of the function that models the tide: 1.amplitude 2.period 3.frequency 4.midline 5.vertical shift 6.phase shift c. create a trigonometric function that models the ocean tide for a period of 12 hours. d.what is the height of the tide after 93 hours?
Answers: 1
You know the right answer?
The test scores on a 100-point test were recorded for 20 students:71 93 91 86 7573 86 82 76 5784 89...
Questions
Mathematics, 29.06.2019 16:30

Mathematics, 29.06.2019 16:30


History, 29.06.2019 16:30

Health, 29.06.2019 16:30
Health, 29.06.2019 16:30
Mathematics, 29.06.2019 16:30
Mathematics, 29.06.2019 16:30


Chemistry, 29.06.2019 16:30


