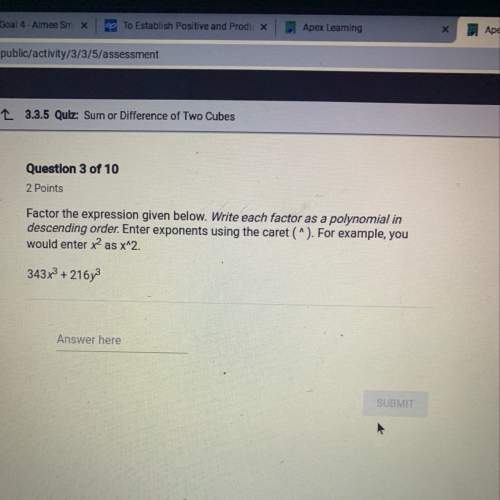
PLEASE HELP HELP HELP
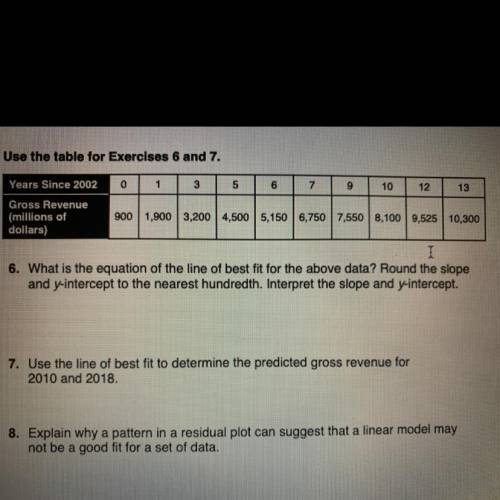
look at the image for the table
1. What is the equation of the li...

Mathematics, 05.02.2021 19:20 tejasheree
PLEASE HELP HELP HELP
look at the image for the table
1. What is the equation of the line of best fit for the above data? Round the slope and y-intercept to the nearest hundredth. Interprets the slope and y-intercept.
2. Use the line of best fit to determine the predicted gross revenue for 2010 and 2018.
3. Explain why a pattern in a residual plot can suggest that linear model may not be a good fit for a set of data.

Answers: 1
Another question on Mathematics
Mathematics, 21.06.2019 18:30
What is the result of converting 60 ounces to pounds remember there are 16 ounces in a pound
Answers: 2
Mathematics, 21.06.2019 19:10
Labc is reflected across x = 1 and y = -3. what are the coordinates of the reflection image of a after both reflections?
Answers: 3
Mathematics, 21.06.2019 20:30
Venita is sewing new curtains. the table below shows the relationship between the number of stitches in a row and the length ofthe row.sewingnumber of stitches length (cm)51 131532024306what is the relationship between the number of stitches and the length? othe number of stitches istimes the length.o. the number of stitches is 3 times the length.
Answers: 2
Mathematics, 21.06.2019 22:30
5. (04.07)which of the following exponential functions goes through the points (1, 12) and (2, 36)? (2 points)f(x) = 3(4)^xf(x) = 4(3)^-xf(x) = 3(4)^-xf(x) = 4(3)^x
Answers: 1
You know the right answer?
Questions

Mathematics, 01.02.2020 11:42

Computers and Technology, 01.02.2020 11:42
English, 01.02.2020 11:42

History, 01.02.2020 11:42

Physics, 01.02.2020 11:42
Mathematics, 01.02.2020 11:42


World Languages, 01.02.2020 11:42

English, 01.02.2020 11:42
Biology, 01.02.2020 11:42
Physics, 01.02.2020 11:42


