
Mathematics, 05.02.2021 01:20 loganparrish5370
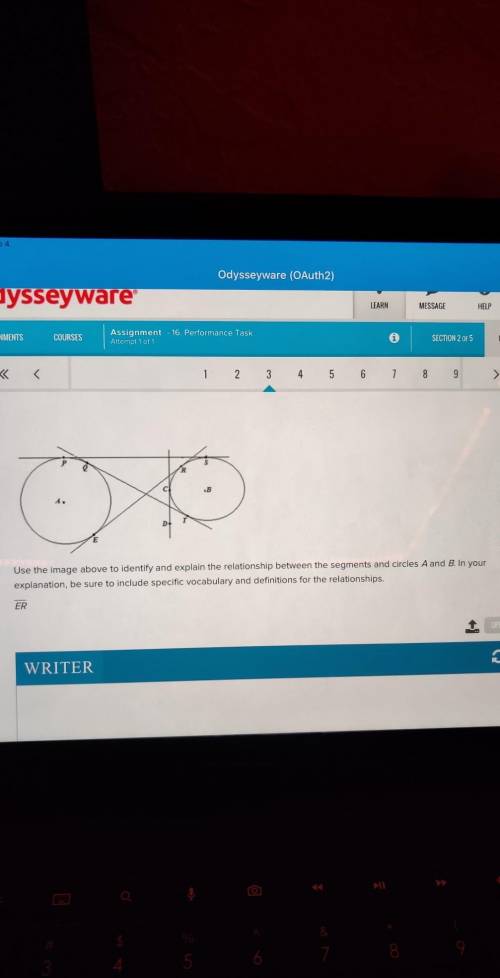
use the image above to identify and explain the relationship between the segments and circles A and B in your explanation, be sure to include specific vocabulary and definitions for the relationships. ER

Answers: 2
Another question on Mathematics
Mathematics, 22.06.2019 02:30
The upcoming championship high school football game is a big deal in your little town. the problem is, it is being played in the next biggest town, which is two hours away! to get as many people as you can to attend the game, you decide to come up with a ride-sharing app, but you want to be sure it will be used before you put all the time in to creating it. you determine that if more than three students share a ride, on average, you will create the app. you conduct simple random sampling of 20 students in a school with a population of 300 students to determine how many students are in each ride-share (carpool) on the way to school every day to get a good idea of who would use the app. the following data are collected: 6 5 5 5 3 2 3 6 2 2 5 4 3 3 4 2 5 3 4 5 construct a 95% confidence interval for the mean number of students who share a ride to school, and interpret the results. part a: state the parameter and check the conditions. part b: construct the confidence interval. be sure to show all your work, including the degrees of freedom, critical value, sample statistics, and an explanation of your process. part c: interpret the meaning of the confidence interval. part d: use your findings to explain whether you should develop the ride-share app for the football game.
Answers: 3
Mathematics, 22.06.2019 04:50
What is the measure of dg? enter your answer in the box.
Answers: 1
Mathematics, 22.06.2019 08:10
Kevin went fishing and is using a scatterplot to analyze the relationship between the weight of each of the fish he caught in pounds and in kilograms. he uses the weight in pounds as the independent variable and the weight in kilograms as the dependent variable. which statement is correct? the points on the scatterplot will go up from left to right because as the weight in pounds increases, the weight in kilograms increases. the points on the scatterplot will go up from left to right because as the weight in pounds increases, the weight in kilograms decreases. the points on the scatterplot will go down from left to right because as the weight in pounds increases, the weight in kilograms increases. the points on the scatterplot will go down from left to right because as the weight in pounds increases, the weight in kilograms decreases.
Answers: 2
You know the right answer?
use the image above to identify and explain the relationship between the segments and circles A and...
Questions

Physics, 29.08.2019 13:30

Mathematics, 29.08.2019 13:30

Mathematics, 29.08.2019 13:30


Mathematics, 29.08.2019 13:30

Mathematics, 29.08.2019 13:30

History, 29.08.2019 13:30
Social Studies, 29.08.2019 13:30

Chemistry, 29.08.2019 13:30
Mathematics, 29.08.2019 13:30


