
Mathematics, 03.02.2021 23:00 ritasolomon85
2.21, 2.25, 2.76, 3.1, 3.3, 3.5, 3.6, 3.77, 3.8, 4.23, 4.25, 4.25, 4.6, and 4.9. Move the rectangle to the graph to create a histogram for this data. Marathon Results Frequency 1 0 Time (hours)

Answers: 2
Another question on Mathematics
Mathematics, 21.06.2019 13:00
Acompany is making new soccer uniforms for a team. the company uses 2.5 yards of fabric for each shirt. the company uses 82.5 yards of fabric to make shirts and shorts for 15 players. the equation and solution below represents the situation. 15(2.5+x)=82.5; x=3 what does the solution, x=3, represent?
Answers: 1
Mathematics, 21.06.2019 13:30
What value of x is in the solution set of –5x – 15 > 10 + 20x?
Answers: 1
Mathematics, 21.06.2019 14:10
which best describes the transformation from the graph of f(x) = x2 to the graph of f(x) = (x – 3)2 – 1? left 3 units, down 1 unitleft 3 units, up 1 unitright 3 units, down 1 unit right 3 units, up 1 unit
Answers: 1
Mathematics, 21.06.2019 23:40
When steve woke up. his temperature was 102 degrees f. two hours later it was 3 degrees lower. what was his temperature then?
Answers: 1
You know the right answer?
2.21, 2.25, 2.76, 3.1, 3.3, 3.5, 3.6, 3.77, 3.8, 4.23, 4.25, 4.25, 4.6, and 4.9. Move the rectangle...
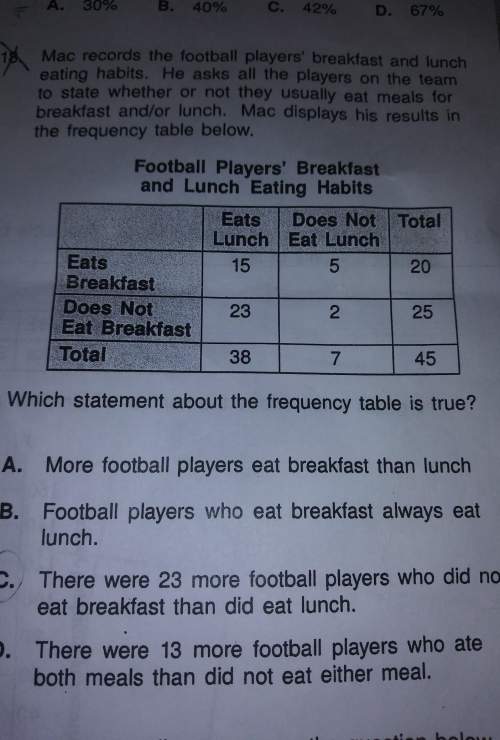
Questions


Social Studies, 10.12.2020 02:10

History, 10.12.2020 02:10
Mathematics, 10.12.2020 02:10
Mathematics, 10.12.2020 02:10
Mathematics, 10.12.2020 02:10
Biology, 10.12.2020 02:10

World Languages, 10.12.2020 02:10

English, 10.12.2020 02:10
Mathematics, 10.12.2020 02:10

Geography, 10.12.2020 02:10
Mathematics, 10.12.2020 02:10

Physics, 10.12.2020 02:10


