
Mathematics, 02.02.2021 03:10 babydolltia28
I already did questions but I need help with the rest
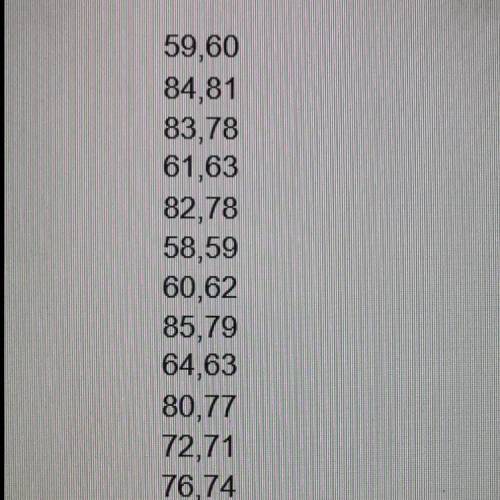
Include your scatter plot and the answers to the following questions in your word processing document.
1. Which variable did you plot on the x-axis, and which variable did you plot on the y-axis? Explain why you assigned the variables in that way.
2. Write the equation of the line of best fit using the slope-intercept formula $y = mx + b$. Show all your work, including the points used to
determine the slope and how the equation was determined,
3. What does the slope of the line represent within the context of your graph? What does the y-intercept represent?
4. Test the residuals of two other points to determine how well the line of best fit models the data
5. Use the line of best fit to help you to describe the data correlation.
6. Using the line of best fit that you found in Part Three, Question 2, approximate how tall is a person whose arm span is 66 inches?
7. According to your line of best fit, what is the arm span of a 74-inch-tall person?

Answers: 2
Another question on Mathematics
Mathematics, 21.06.2019 22:30
Which of the following graphs could represent a quartic function?
Answers: 1
Mathematics, 21.06.2019 23:00
Could someone me with this question i’ve been stuck on it for 20 minutes
Answers: 1
Mathematics, 21.06.2019 23:20
Using only the digits 5, 6, 7, 8, how many different three digit numbers can be formed if no digit is repeated in a number?
Answers: 1
You know the right answer?
I already did questions but I need help with the rest
Include your scatter plot and the answers to...
Questions
Mathematics, 22.04.2021 23:10

Biology, 22.04.2021 23:10

Mathematics, 22.04.2021 23:10

Arts, 22.04.2021 23:10
Mathematics, 22.04.2021 23:10
Mathematics, 22.04.2021 23:10

Computers and Technology, 22.04.2021 23:10

History, 22.04.2021 23:10
Biology, 22.04.2021 23:10
Mathematics, 22.04.2021 23:10

Business, 22.04.2021 23:10


