
Mathematics, 02.02.2021 01:00 Person51761
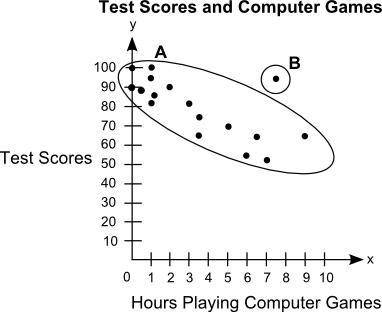
The scatter plot shows the relationship between the test scores of a group of students and the number of hours they play computer games in a week: On a grid, Label Hours Playing Computer Games on x axis and Test Scores on y axis. The title of the graph is Test Scores and Computer Games. The scale on the x axis shows the numbers from 0 to 10 at increments of 1, and the scale on the y axis shows numbers from 0 to 100 at increments of 10. Dots are made at the ordered pairs 0, 90 and 0, 100 and 0.5, 89 and 1, 81 and 1, 95 and 1, 100 and 1.1, 85 and 2, 90 and 3, 81 and 3.5, 65 and 3.5, 75 and 5, 70 and 6, 55 and 6.5, 65 and 7, 52 and 7.5, 95 and 9, 65. The ordered pair 7.5, 95 is circled and labeled as B. All the other points are put in an oval and labeled as A. Part A: What is the group of points labeled A called? What is the point labeled B called? Give a possible reason for the presence of point B. (5 points) Part B: Describe the association between students' test scores and the number of hours they play computer games. (5 points)

Answers: 2
Another question on Mathematics
Mathematics, 21.06.2019 20:30
What is the best approximation for the area of a circle with a radius of 4 m ? use 3.14 to approximate pi
Answers: 1
Mathematics, 22.06.2019 03:00
Which rotation about its center will carry a regular hexagon onto itself
Answers: 3
You know the right answer?
The scatter plot shows the relationship between the test scores of a group of students and the numbe...
Questions


Mathematics, 23.09.2019 20:00

Business, 23.09.2019 20:00
History, 23.09.2019 20:00
Mathematics, 23.09.2019 20:00

Health, 23.09.2019 20:00

Mathematics, 23.09.2019 20:00


Computers and Technology, 23.09.2019 20:00

English, 23.09.2019 20:00
Mathematics, 23.09.2019 20:00


