7. The graph below shows the relationship
between the amount of money in Sarah's
savings acco...

Mathematics, 29.01.2021 02:50 sherlock19
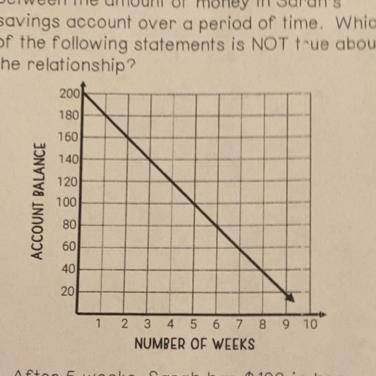
7. The graph below shows the relationship
between the amount of money in Sarah's
savings account over a period of time. Which
of the following statements is NOT true about
the relationship?
200
180
760
ACCOUNT BALANCE
7401
120
700
80
60
40
20
1 2 3 4 5 6 7 8 9 10
NUMBER OF WEEKS
A. After 5 weeks, Sarah has $ 100 in her
account.
B. If Sarah has a balance of $60, then 7
weeks have passed.
C. The relationship is proportional.
D. The situation can be represented by the
equation y = 200 - 20x.

Answers: 2
Another question on Mathematics
Mathematics, 21.06.2019 15:30
The table respent two linear functions the equation respented by the first tables is given
Answers: 2
Mathematics, 21.06.2019 17:30
25 ! the line of best fit is h = 5a + 86. predict the height at age 16. show your work.
Answers: 1
You know the right answer?
Questions

Computers and Technology, 17.04.2020 20:00


Chemistry, 17.04.2020 20:01
Chemistry, 17.04.2020 20:01


English, 17.04.2020 20:01


