
Mathematics, 28.01.2021 22:00 hannahponder
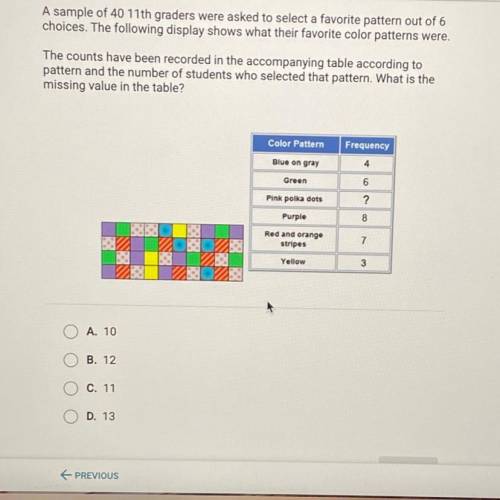
A sample of 40 11th graders were asked to select a favorite pattern out of 6
choices. The following display shows what their favorite color patterns were.
The counts have been recorded in the accompanying table according to
pattern and the number of students who selected that pattern. What is the
missing value in the table?
Color Pattern
Frequency
Blue on gray
4
Green
6
Pink polka dots
?
8
Purple
Red and orange
stripes
7
Yellow
3
O A. 10
B. 12
C. 11
D. 13

Answers: 2
Another question on Mathematics
Mathematics, 21.06.2019 18:30
Afarm that has 4 x 10^2 acres has 1.2 x 10^5 cattle. what is the average number of cattle per acre? write the answer in scientific notation. answere asap
Answers: 1
Mathematics, 21.06.2019 19:30
The volume of a cube-shaped shipping container is 13,824 cubic inches. find the edge length of the shipping container.
Answers: 1
Mathematics, 21.06.2019 20:40
Askate shop rents roller skates as shown on the table below. which graph and function models this situation?
Answers: 1
You know the right answer?
A sample of 40 11th graders were asked to select a favorite pattern out of 6
choices. The following...
Questions

History, 04.02.2021 01:00


Mathematics, 04.02.2021 01:00
Mathematics, 04.02.2021 01:00
Chemistry, 04.02.2021 01:00


English, 04.02.2021 01:00
Chemistry, 04.02.2021 01:00
Mathematics, 04.02.2021 01:00
English, 04.02.2021 01:00
Mathematics, 04.02.2021 01:00
Mathematics, 04.02.2021 01:00
Mathematics, 04.02.2021 01:00
Mathematics, 04.02.2021 01:00
Chemistry, 04.02.2021 01:00


