
Application/8
usal Sharipova Jan 23, 2011
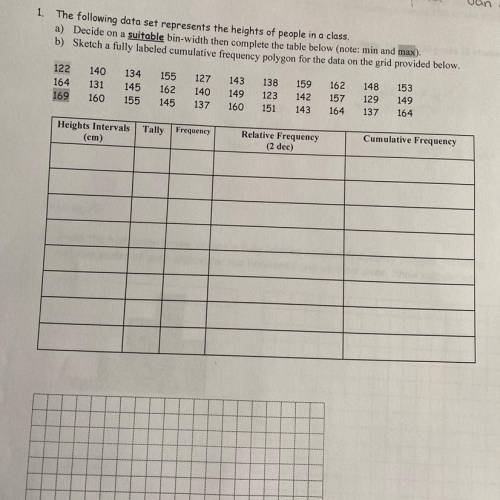
1. The following data set represents the heights of...

Mathematics, 22.01.2021 19:50 MK100
Application/8
usal Sharipova Jan 23, 2011
1. The following data set represents the heights of people in a class.
a) Decide on a suitable bin-width then complete the table below (note: min and max)
b) Sketch a fully labeled cumulative frequency polygon for the data on the grid provided below.
122
140
134 155 127 143 138 159 162 148 153
164
131 145
162
140 149 123 142 157 129 149
169 160 155 145 137 160 151 143 164
137
164
Cumulative Frequency
Heights Intervals Tally Frequency
(cm)
Relative Frequency
(2 dec)

Answers: 1
Another question on Mathematics
Mathematics, 21.06.2019 19:00
What is the percentile for data value 6 in the following data set? 4 13 8 6 4 4 13 6 4 13 2 13 15 5 9 4 12 8 6 13 40 25 35 62
Answers: 2
Mathematics, 21.06.2019 19:30
Asquare picture with sides of 32 inches is to be mounted on a square mat with sides of 52 inches. find the area of the mat that will remain uncovered by the picture.
Answers: 1
Mathematics, 21.06.2019 20:20
Complete the input-output table for the linear function y = 3x. complete the input-output table for the linear function y = 3x. a = b = c =
Answers: 2
Mathematics, 21.06.2019 22:00
Prove sin2a + cos2a - 1 / sin2a + cos2a + 1 = 1 - tana / 1 + cota
Answers: 2
You know the right answer?
Questions


English, 30.11.2021 23:30


Biology, 30.11.2021 23:30


History, 30.11.2021 23:30
Mathematics, 30.11.2021 23:30
SAT, 30.11.2021 23:30
Mathematics, 30.11.2021 23:30

Chemistry, 30.11.2021 23:30


