
Mathematics, 20.01.2021 04:10 shainaanderson24
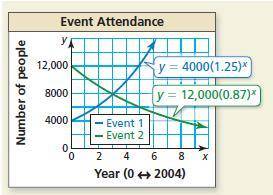
The graph shows the annual attendance at two events. Each event began in 2004.
a. Estimate when the events will have about the same attendance.
The events will have about the same attendance in the year ___.
b. Explain how you can verify your answer in part (a).
a. Substitute the answer in part (a) into both equations for y and solve for x.
b. Set the equations equal to zero, solve for x, then find the average of the two x-values.
c. Graph the two equations on a graphing calculator and use the intersect feature to find the point of intersection.
d. See how many times you have to multiply 4000 by 1.25 to obtain a product of approximately 12,000.

Answers: 2
Another question on Mathematics
Mathematics, 21.06.2019 17:00
Evaluate the expression for the given value of the variable 2×(c2-5) for c=4
Answers: 1
Mathematics, 21.06.2019 18:00
Tickets to a science exposition cost $5.75 each for studentd and $7.00 for adults.how many students and adults went if the ticket charge was $42.75
Answers: 1
Mathematics, 21.06.2019 18:30
Let f(x) = 3 − x . find the average rate of change of f(x) from x = a to x = a + h and simplify your answer so that no single factor of h is left in the denominator.
Answers: 1
Mathematics, 21.06.2019 20:00
True or false: the graph of y=f(bx) is a horizontal compression of the graph y=f(x) if b< 1
Answers: 2
You know the right answer?
The graph shows the annual attendance at two events. Each event began in 2004.
a. Estimate when the...
Questions

Biology, 20.10.2020 03:01


Medicine, 20.10.2020 03:01

Mathematics, 20.10.2020 03:01

Business, 20.10.2020 03:01

Social Studies, 20.10.2020 03:01

Spanish, 20.10.2020 03:01


Mathematics, 20.10.2020 03:01
History, 20.10.2020 03:01
Chemistry, 20.10.2020 03:01
Mathematics, 20.10.2020 03:01

Arts, 20.10.2020 03:01


