You are to create your own relationship between
the water level (cm) in the pool and time in
...

Mathematics, 18.01.2021 17:30 itsdria
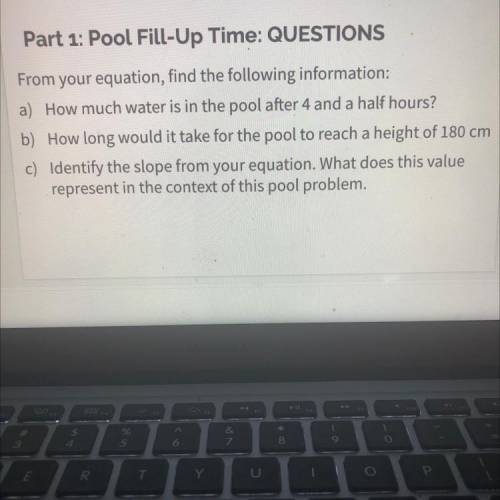
You are to create your own relationship between
the water level (cm) in the pool and time in
hours) that starts as you begin filling the pool. You
must create the following representations of your
relationship
(1) TABLE, (2) GRAPH, (3) EQUATION
AS SHOWN ON THE NEXT SLIDE
Your relationship must meet the following
requirements:
1. The pool has water in it to start: you chose
an amount between 50 cm to 100 cm
2. You chose a time between 15 and 24 hours
a
that you believe will take to fill the pool.
3. You are filling the pool at a constant rate
5. You choose the final water level. The final
water level has to be between 200 to 300 cm
Please help

Answers: 2
Another question on Mathematics
Mathematics, 21.06.2019 15:00
Martha needs 22.25 strawberries for every 5 smoothies she makes. complete the table to see how many strawberries she would need to make 10 smoothies and 20 smoothies.
Answers: 1
Mathematics, 21.06.2019 16:00
Part one: measurements 1. measure your own height and arm span (from finger-tip to finger-tip) in inches. you will likely need some from a parent, guardian, or sibling to get accurate measurements. record your measurements on the "data record" document. use the "data record" to you complete part two of this project. name relationship to student x height in inches y arm span in inches archie dad 72 72 ginelle mom 65 66 sarah sister 64 65 meleah sister 66 3/4 67 rachel sister 53 1/2 53 emily auntie 66 1/2 66 hannah myself 66 1/2 69 part two: representation of data with plots 1. using graphing software of your choice, create a scatter plot of your data. predict the line of best fit, and sketch it on your graph. part three: the line of best fit include your scatter plot and the answers to the following questions in your word processing document 1. 1. which variable did you plot on the x-axis, and which variable did you plot on the y-axis? explain why you assigned the variables in that way. 2. write the equation of the line of best fit using the slope-intercept formula $y = mx + b$. show all your work, including the points used to determine the slope and how the equation was determined. 3. what does the slope of the line represent within the context of your graph? what does the y-intercept represent? 5. use the line of best fit to you to describe the data correlation.
Answers: 2
Mathematics, 21.06.2019 17:30
Simplify this expression.2(10) + 2(x – 4) a. 2x + 16 b. x + 12 c. 2x + 12 d. x + 16
Answers: 2
Mathematics, 21.06.2019 22:30
Which statement shows that 6.24 is a rational number? a. 6.24 = 6.242424 b. 6.24 = 6.24 c. 6.24 = 68⁄33 d. 6.24 = 66⁄25
Answers: 1
You know the right answer?
Questions
Mathematics, 20.05.2021 07:20

Physics, 20.05.2021 07:20

Geography, 20.05.2021 07:20

Mathematics, 20.05.2021 07:20

Chemistry, 20.05.2021 07:20

History, 20.05.2021 07:20
Mathematics, 20.05.2021 07:20
Spanish, 20.05.2021 07:20


Mathematics, 20.05.2021 07:20


