
Mathematics, 15.01.2021 02:40 ooferson
NEED HELP ASASPPP
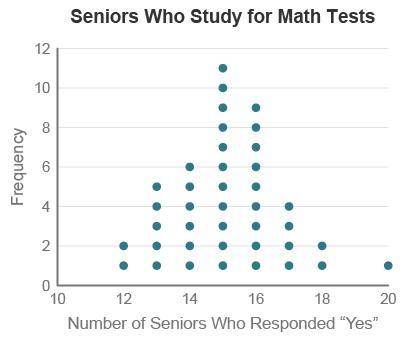
A study reported that about half of high school seniors study for upcoming math tests. To find out if this applies to seniors at Garfield High School, an SRS of 30 seniors was asked if they study for their math tests. Nineteen responded "Yes.”
A dotplot is provided showing the results of 40 trials of this simulation.
A dotplot titled seniors who study for math tests have number of seniors who responded yes on the x-axis, and frequency on the y-axis. 12, 2; 13, 5; 14, 6; 15, 11; 16, 9; 17, 4; 18, 2; 9, 0; 20, 1.
Does this provide convincing evidence that seniors at Garfield High School study more than the report stated?
No, there is an outlier at 20.
No, there were outcomes as low as 12.
Yes, only one trial had a result of 19 or larger.
Yes, more than half of the simulated results are over 15.

Answers: 3
Another question on Mathematics
Mathematics, 21.06.2019 17:30
To which sets of numbers does -12 belong? choose all answers that are correct. a) natural numbers b) integers c) real numbers d) irrational numbers
Answers: 2
Mathematics, 21.06.2019 22:00
The customer price index(cpi), which measures the cost of a typical package of customer goods,was 208.8 in 2011 and 244.1 in 2016.let x=11 corresponding to the year 2011 an estimate to cpi into 2013 and 2014. assume that the data can be modeled by a straight line and the trend to continue idenfinitely.use data points to find such a line and then estimate the requested quantities
Answers: 1
Mathematics, 22.06.2019 02:50
Asap! i need this done today and i really don’t understand it. some one ! will mark
Answers: 1
Mathematics, 22.06.2019 03:40
Anull hypothesis states that the difference between 8 hours of sleep and 3 hours of sleep has no effect on the number of pictures a student will remember during a picture memory interface test (pmit). examining the mit database, an extremely small t-value of 0.1611 is found. this t-value is much smaller than the smallest t-value on the chart for p-value reference. from this information we can: select one: a. accept the null hypothesis because the p-value obtained shows that the difference between the two groups being tested is not statistically significant b. accept the null hypothesis because the p-value obtained was statistically significant c. reject the null hypothesis because of the p-value obtained d. reject the null hypothesis because the data obtained is statistically significant
Answers: 3
You know the right answer?
NEED HELP ASASPPP
A study reported that about half of high school seniors study for upcoming math t...
Questions


English, 13.11.2019 05:31

Mathematics, 13.11.2019 05:31


Mathematics, 13.11.2019 05:31

Physics, 13.11.2019 05:31
Mathematics, 13.11.2019 05:31
History, 13.11.2019 05:31
Mathematics, 13.11.2019 05:31


