
Mathematics, 15.01.2021 01:00 AngChell21
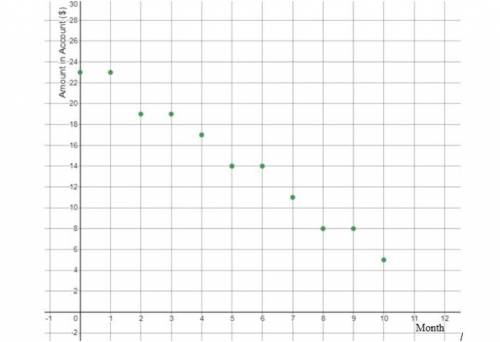
Two students have examined the scatter plot shown and have created a line of best fit for the data. Student A believes that the line of best fit for the data is y=−2x+24, while Student B believes that the line of best fit for the data is y=1.5x+23. Determine which student created a better line of best fit given the data in the graph. Justify your answer using mathematics.

Answers: 1
Another question on Mathematics
Mathematics, 21.06.2019 17:30
How is the number of vertices for a prism related to the name of the prism
Answers: 1
Mathematics, 21.06.2019 20:30
Tom is the deli manager at a grocery store. he needs to schedule employee to staff the deli department for no more that 260 person-hours per week. tom has one part-time employee who works 20 person-hours per week. each full-time employee works 40 person-hours per week. write and inequality to determine n, the number of full-time employees tom may schedule, so that his employees work on more than 260 person-hours per week. graph the solution set to this inequality.
Answers: 1
Mathematics, 21.06.2019 20:50
These tables represent a quadratic function with a vertex at (0, -1). what is the average rate of change for the interval from x = 9 to x = 10?
Answers: 2
Mathematics, 21.06.2019 22:00
Which is the correct first step in finding the area of the base of a cylinder with a volume of 26x cubic meters and a height of 6.5 meters? v=bh 6.5=b(26x) v=bh v=26pi+(6.5) v=bh v=26pi(6.5) v=bh 26pi=b(6.5)
Answers: 1
You know the right answer?
Two students have examined the scatter plot shown and have created a line of best fit for the data....
Questions
Mathematics, 29.08.2020 02:01

Computers and Technology, 29.08.2020 02:01

Computers and Technology, 29.08.2020 02:01


Geography, 29.08.2020 02:01


Health, 29.08.2020 02:01

History, 29.08.2020 02:01


