
Mathematics, 08.01.2021 21:40 xaxtusgod
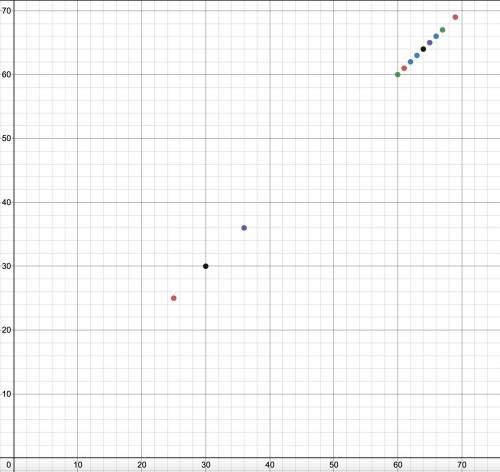
1. Which variable did you plot on the x-axis, and which variable did you plot on the y-axis? Explain why you assigned the variables in that way.
2. Write the equation of the line of best fit using the slope-intercept formula $y = mx + b$. Show all your work, including the points used to determine the slope and how the equation was determined.
3. What does the slope of the line represent within the context of your graph? What does the y-intercept represent?
4. Test the residuals of two other points to determine how well the line of best fit models the data.
I've included a picture of my graph down below I just really need number 1 and 2 at the moment but any question answered through 1 and 4 would we very appreciated :) thank you very much :D I will be reporting answers that aren't correct, silly, or unhelpful because I just really need these answers and it only allows up to 2 people to answer.

Answers: 3
Another question on Mathematics
Mathematics, 21.06.2019 17:00
Steve wants to develop a way to find the total cost of any item including sales tax. the sales tax in his city is 6%. his friend jenna writes the expression x + 6x where x is the cost of the item. explain whether her expression is correct based on the situation.
Answers: 1
Mathematics, 21.06.2019 19:50
If your teacher tells you to do questions 6 through 19 in your math book for homework, how many questions is that
Answers: 1
Mathematics, 21.06.2019 21:20
Christine wong has asked dave and mike to her move into a new apartment on sunday morning. she has asked them both, in case one of them does not show up. from past experience, christine knows that there is a 40% chance that dave will not show up and a 30% chance that mik a. what is the probability that both dave and mike will show up? (round your answer to 2 decimal places.) b. what is the probability that at least one of them will show up? c. what is the probability that neither dave nor mike will show up? (round your answer to 2 decimal places.)e will not show up. dave and mike do not know each other and their decisions can be assumed to be independent.
Answers: 2
Mathematics, 21.06.2019 21:30
In a test for esp (extrasensory perception), the experimenter looks at cards that are hidden from the subject. each card contains either a star, a circle, a wave, a cross or a square.(five shapes) as the experimenter looks at each of 20 cards in turn, the subject names the shape on the card. when the esp study described above discovers a subject whose performance appears to be better than guessing, the study continues at greater length. the experimenter looks at many cards bearing one of five shapes (star, square, circle, wave, and cross) in an order determined by random numbers. the subject cannot see the experimenter as he looks at each card in turn, in order to avoid any possible nonverbal clues. the answers of a subject who does not have esp should be independent observations, each with probability 1/5 of success. we record 1000 attempts. which of the following assumptions must be met in order to solve this problem? it's reasonable to assume normality 0.8(1000), 0.2(1000)%30 approximately normal 0.8(1000), 0.2(1000)% 10 approximately normal srs it is reasonable to assume the total number of cards is over 10,000 it is reasonable to assume the total number of cards is over 1000
Answers: 1
You know the right answer?
1. Which variable did you plot on the x-axis, and which variable did you plot on the y-axis? Explain...
Questions


History, 19.01.2021 21:00
Mathematics, 19.01.2021 21:00


Health, 19.01.2021 21:00
Mathematics, 19.01.2021 21:00
English, 19.01.2021 21:00
Mathematics, 19.01.2021 21:00


Social Studies, 19.01.2021 21:00


