
Mathematics, 08.01.2021 05:30 slrich21
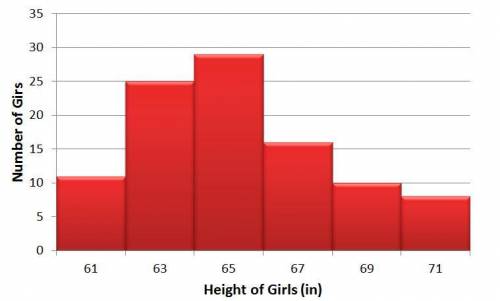
The histogram shows a distribution of girls' heights in inches.
Which statement best describes the distribution?
A.
The data is positively skewed because the majority of the data is clustered to the left of the center.
B.
The data is negatively skewed because the majority of the data is clustered to the left of the center.
C.
The data is positively skewed because the majority of the data is clustered to the right of the center.
D.
The data is negatively skewed because the majority of the data is clustered to the right of the center.

Answers: 1
Another question on Mathematics
Mathematics, 21.06.2019 20:00
If benito is selecting samples of five values from the table, which row will result in the greatest mean? population data row 1 4 2 2 3 3 row 2 3 3 4 3 2 row 3 2 4 3 4 3 row 4 3 4 4 7 3 row 1 row 2 r
Answers: 1
Mathematics, 21.06.2019 22:00
Let event a = you roll an even number on the first cube.let event b = you roll a 6 on the second cube.are the events independent or dependent? why?
Answers: 1
You know the right answer?
The histogram shows a distribution of girls' heights in inches.
Which statement best describes the...
Questions

English, 07.07.2021 03:20
Mathematics, 07.07.2021 03:20
Mathematics, 07.07.2021 03:20


History, 07.07.2021 03:20


