PLEASE ANSWER CORRECTLY! ALSO PLEASE ANSWER ALL (A B C D)
STEP 3
You and your business partne...

Mathematics, 08.01.2021 01:00 lerasteidl
PLEASE ANSWER CORRECTLY! ALSO PLEASE ANSWER ALL (A B C D)
STEP 3
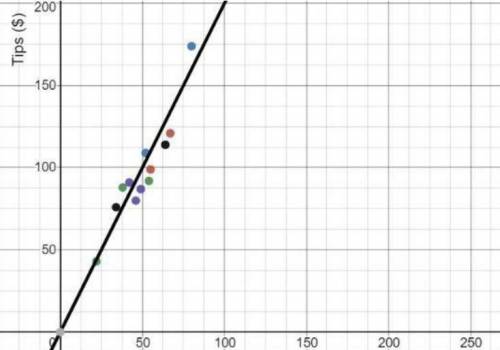
You and your business partner track the number of customers served and the amount of tips collected per day. The data you gathered is displayed in the chart below.
Servers’ Collected Tips
Customers 54 46 34 67 52 22 49 64 55 80 38 42
Tips ($) $92 $80 $76 $121 $109 $43 $87 $114 $99 $174 $88 $91
a) Create a scatterplot displaying the data in the table. Be sure to include a linear trend line.
b) Find the equation of the trend line (line of best fit). Show your work.
c) Predict the amount of tips that would be collected if 100 customers were served at the restaurant on a given day. Explain your reasoning.
d) Explain how to use the regression calculator to make a reasonable prediction given a data table.

Answers: 1
Another question on Mathematics
Mathematics, 21.06.2019 14:00
In factoring by grouping, what would you have for step 3 for the following? step 1: x^3 +5x^2 +4x+20 step 2: x^2 (x+5)+4(x+5) step 3: ?
Answers: 2
Mathematics, 22.06.2019 00:00
How many quarts of a 50% solution of acid must be added to 20 quarts of a 20% solution of acid in order to get a 40% solution of acid?
Answers: 2
Mathematics, 22.06.2019 02:00
The half-life of a certain material is 0.004 second. approximately how much of a 20-gram sample will be left after 0.016 second? a. 5 grams b. 16 grams c. 0.32 gram d. 1.25 grams
Answers: 3
Mathematics, 22.06.2019 03:00
Which rotation about its center will carry a regular hexagon onto itself
Answers: 3
You know the right answer?
Questions


Mathematics, 04.08.2019 12:00


Social Studies, 04.08.2019 12:00
Mathematics, 04.08.2019 12:00
Mathematics, 04.08.2019 12:00
Business, 04.08.2019 12:00
Mathematics, 04.08.2019 12:00
History, 04.08.2019 12:00


