20

Mathematics, 07.01.2021 18:40 syulerio8418
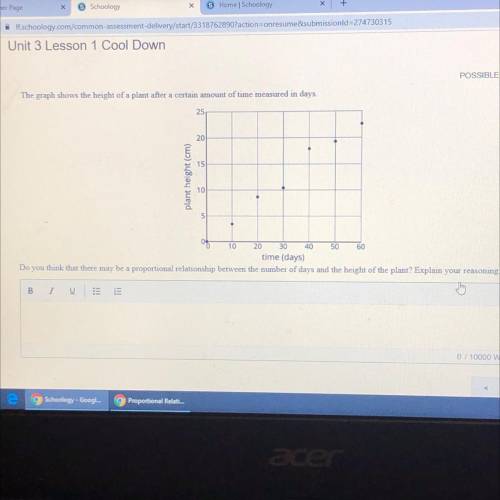
The graph shows the height of a plant after a certain amount of time measured in days
25
20
plant height (cm)
10
30
SO
60
20
time (days)
Do you think that there may be a proportional relationship between the number of days and the height of the plant? Explain your reasoning
B

Answers: 1
Another question on Mathematics
Mathematics, 21.06.2019 19:10
Labc is reflected across x = 1 and y = -3. what are the coordinates of the reflection image of a after both reflections?
Answers: 3
Mathematics, 21.06.2019 20:00
1: 4 if the wew 35 surfboards at the beach how many were short boards?
Answers: 1
You know the right answer?
The graph shows the height of a plant after a certain amount of time measured in days
25
20
20
Questions

Computers and Technology, 28.05.2020 17:59

Mathematics, 28.05.2020 17:59
Mathematics, 28.05.2020 17:59

Computers and Technology, 28.05.2020 18:00


