
Mathematics, 04.01.2021 18:20 brendaesme
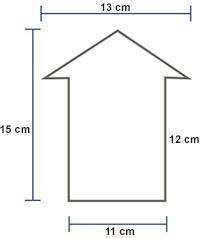
On a bicycle trail, the city is painting arrows like the one shown below:
Upper pointing arrow with height of 15 and length of 13. Rectangular base of arrow has length of 11 and height of 12. All units are in centimeters.
Calculate the area of the arrow by decomposing it into rectangles and triangles.
148.5 square centimeters
151.5 square centimeters
171 square centimeters
195 square centimeters

Answers: 2
Another question on Mathematics
Mathematics, 21.06.2019 13:00
Solve the system by the elimination method. 3x - 2y - 7 = 0 5x + y - 3 = 0 to eliminate y, the lcm is 2. which of the following is the resulting equations? 1.3x - 2y - 7 = 0 5x + y - 3 = 0 2.3x - 2y - 7 = 0 -10x - 2y + 6 = 0 3.3x - 2y - 7 = 0 10x + 2y - 6 = 0
Answers: 1
Mathematics, 21.06.2019 19:30
Agarden consists of an apple tree, a pear tree, cauliflowers, and heads of cabbage. there are 40 vegetables in the garden. 24 of them are cauliflowers. what is the ratio of the number of cauliflowers to the number of heads of cabbage?
Answers: 2
Mathematics, 22.06.2019 02:20
Stu and ambrose are working together on a study of whether diet is related to students' mental health. first, they randomly select 10 students from the student center and 10 students from the office of counseling and psychological services. then, they ask students to rate their diet in terms of healthiness on a scale of 1-100 before completing a 20-item mental health survey. a) name one of the constructs being studied b) how was the construct you named above operationally defined in this experiment? e) was the variable you described above their independent variable, their dependent variable, or a controlled variable? d) what is a confounding variable? what is a potential confound in this study?
Answers: 3
Mathematics, 22.06.2019 02:30
Atrain traveled for 1.5 hours to the first station, stopped for 30 minutes, then traveled for 4 hours to the final station where it stopped for 1 hour. the total distance traveled is a function of time. which graph most accurately represents this scenario? a graph is shown with the x-axis labeled time (in hours) and the y-axis labeled total distance (in miles). the line begins at the origin and moves upward for 1.5 hours. the line then continues upward at a slow rate until 2 hours. from 2 to 6 hours, the line continues quickly upward. from 6 to 7 hours, it moves downward until it touches the x-axis a graph is shown with the axis labeled time (in hours) and the y axis labeled total distance (in miles). a line is shown beginning at the origin. the line moves upward until 1.5 hours, then is a horizontal line until 2 hours. the line moves quickly upward again until 6 hours, and then is horizontal until 7 hours a graph is shown with the axis labeled time (in hours) and the y-axis labeled total distance (in miles). the line begins at the y-axis where y equals 125. it is horizontal until 1.5 hours, then moves downward until 2 hours where it touches the x-axis. the line moves upward until 6 hours and then moves downward until 7 hours where it touches the x-axis a graph is shown with the axis labeled time (in hours) and the y-axis labeled total distance (in miles). the line begins at y equals 125 and is horizontal for 1.5 hours. the line moves downward until 2 hours, then back up until 5.5 hours. the line is horizontal from 5.5 to 7 hours
Answers: 1
You know the right answer?
On a bicycle trail, the city is painting arrows like the one shown below:
Upper pointing arrow with...
Questions
Mathematics, 03.08.2019 23:00

History, 03.08.2019 23:00
History, 03.08.2019 23:00
Mathematics, 03.08.2019 23:00

Mathematics, 03.08.2019 23:00
Mathematics, 03.08.2019 23:00
History, 03.08.2019 23:00
Mathematics, 03.08.2019 23:00

Computers and Technology, 03.08.2019 23:00


