
Mathematics, 03.01.2021 08:50 makenahbriana
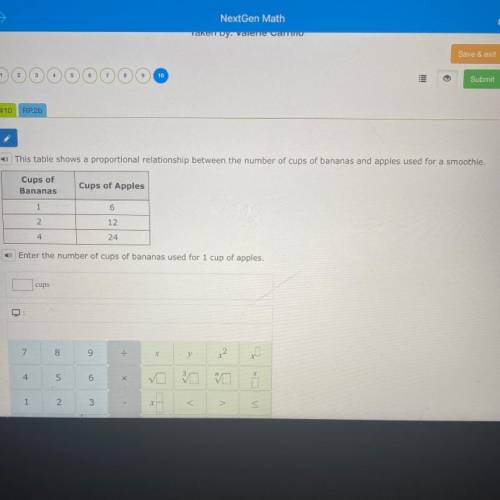
This table shows a proportional relationship between the number of cups of bananas and apples used for a smoothie.
Cups of
Bananas
Cups of Apples
1
6
2
12
4
24
Enter the number of cups of bananas used for 1 cup of apples.
cups

Answers: 1
Another question on Mathematics
Mathematics, 21.06.2019 17:00
The table shows population statistics for the ages of best actor and best supporting actor winners at an awards ceremony. the distributions of the ages are approximately bell-shaped. compare the z-scores for the actors in the following situation. best actor best supporting actor muequals42.0 muequals49.0 sigmaequals7.3 sigmaequals15 in a particular year, the best actor was 59 years old and the best supporting actor was 45 years old. determine the z-scores for each. best actor: z equals best supporting actor: z equals (round to two decimal places as needed.) interpret the z-scores. the best actor was (more than 2 standard deviations above more than 1 standard deviation above less than 1 standard deviation above less than 2 standard deviations below) the mean, which (is not, is) unusual. the best supporting actor was (less than 1 standard deviation below more than 1 standard deviation above more than 2 standard deviations below more than 1 standard deviation below) the mean, which (is is not) unusual.
Answers: 1
Mathematics, 21.06.2019 21:00
*let m∠cob = 50°30’, m∠aob = 70° and m∠aoc = 20°30’. could point c be in the interior of ∠aob? why?
Answers: 1
Mathematics, 22.06.2019 00:00
Ascientist studied a population of workers to determine whether verbal praise and/or tangible rewards affect employee productivity. in the study, some workers were offered verbal praise, some were offered tangible rewards (gift cards, presents, and some were offered neither. the productivity of each participant was measured throughout the study by recording the number of daily tasks completed by each employee. which inference might the scientists make based on the given information? a.) the number of daily tasks completed by each employee may influence the dependent variable, which is whether the employee receives verbal praise, tangible rewards, or neither. b.) verbal praise and/or tangible rewards may influence the independent variable, which is the number of daily tasks completed by each employee. c.) verbal praise and/or tangible rewards may influence the dependent variable, which is the number of daily tasks completed by each employee. d.) the dependent variables, which are verbal praise and tangible rewards, may influence the number of daily tasks completed by each employee.
Answers: 1
Mathematics, 22.06.2019 02:30
The gdp is $1,465.2 billion. the population is 249,793,675. find the per capita gdp.
Answers: 1
You know the right answer?
This table shows a proportional relationship between the number of cups of bananas and apples used f...
Questions

Health, 30.08.2019 15:00


Social Studies, 30.08.2019 15:00
English, 30.08.2019 15:00

Chemistry, 30.08.2019 15:00
Mathematics, 30.08.2019 15:00
Mathematics, 30.08.2019 15:00
Social Studies, 30.08.2019 15:00
History, 30.08.2019 15:00
Mathematics, 30.08.2019 15:00

Biology, 30.08.2019 15:00
English, 30.08.2019 15:00
Biology, 30.08.2019 15:00

Spanish, 30.08.2019 15:00
Mathematics, 30.08.2019 15:00


